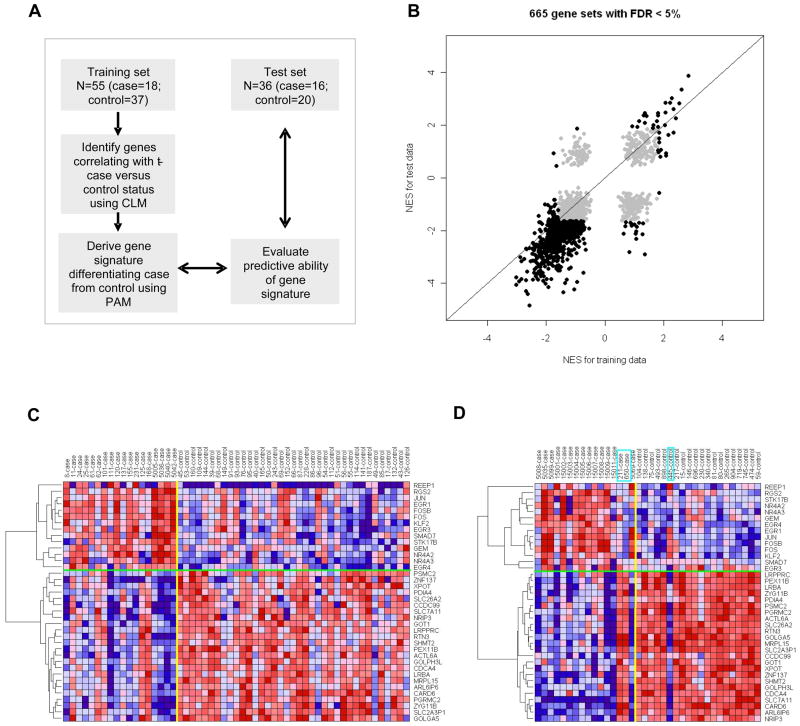
Figure 4. Validation of altered gene expression in PBSC from t-MDS/AML cases and outcome prediction.
(A) Strategy for development and validation of a gene signature to differentiate PBSC from cases and controls. PAM represents prediction analysis of microarrays. (B) Normalized enrichment scores (NES) from GSEA analyses for 665 gene sets with FDR <5% in PBSC CD34+ from either training set or test set are highlighted. Six hundred and thirty six (95.6%) sets were in agreement between the two studies, with 34 gene sets upregulated and 602 gene sets downregulated in both training and test sets. (C) Expression for the 38-gene signature derived using PAM in the training PBSC set. (D) Expression for the 38-gene signature in the test PBSC set. The boxes indicate the three subjects that were misclassified by the gene signature. See also Figure S3 and Tables S8, S9, S10 and S11.

