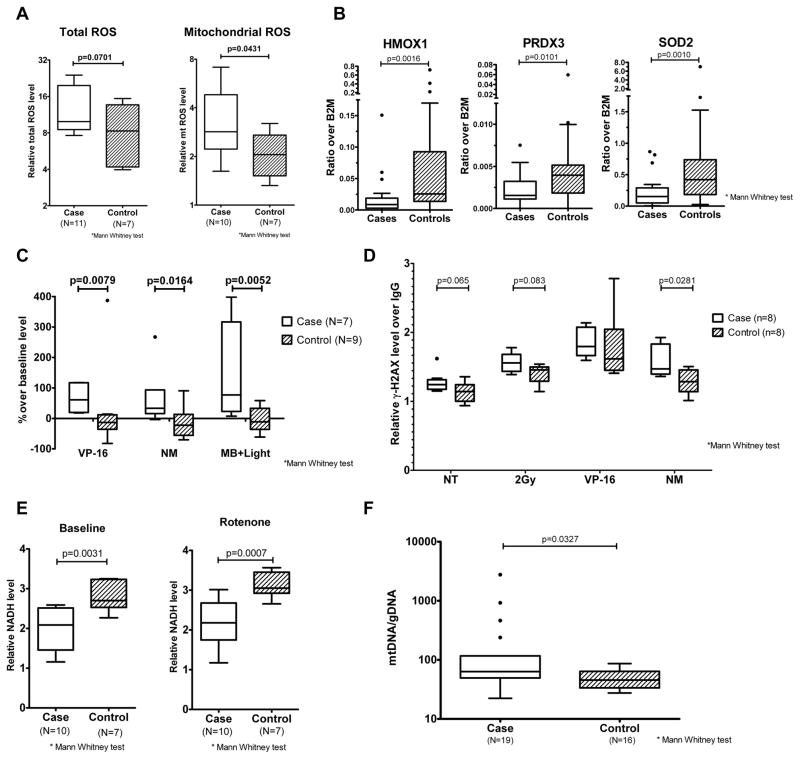
Figure 5. Mitochondrial dysfunction and metabolic abnormalities in PBSC from patients developing t-MDS/AML.
(A) Mitochondrial ROS and total ROS levels in PBSC CD34+ cells from cases (red) and controls (blue) detected with C-H2DCFDA and MitoSox RED respectively. Results represent median, interquartile range and range of values. (B) Expression of Nrf2 regulated anti-oxidant genes heme oxygenase 1 (HMOX1), peroxiredoxin 3 (PRDX3) and superoxide dismutase 2 (SOD2) in PBSC CD34+ cells from cases (red, n=20) and controls (blue, n=39) quantified using Q-PCR. Results represent median, interquartile range and range of values. (C) ROS levels in PBSC CD34+ cells from cases (red) and controls (blue), measured 2 hours after exposure to etoposide (VP-16), nitrogen mustard (NM) and methylene blue with visible light (MB+Light) by C-H2DCFDA labeling. Results represent median, interquartile range and range of values. (D) DNA damage in PBSC CD34+ cells from cases (red) and controls (blue), measured 4 hours after exposure to radiation (2Gy), VP-16 and NM as well as no treatment controls (NT) by measuring γ-H2AX levels. Results represent median, interquartile range and range of values. (E) NADH levels in PBSC CD34+ cells from cases (red) and controls (blue) measured at baseline and after rotenone treatment. Results represent median, interquartile range and range of values. (F) Mitochondrial mass was estimated in PBSC MNC isolated from cases (n=19) and controls (n=16) through measurement of mitochondrial DNA content. Results represent median, interquartile range and range of values. See also Figure S4.

