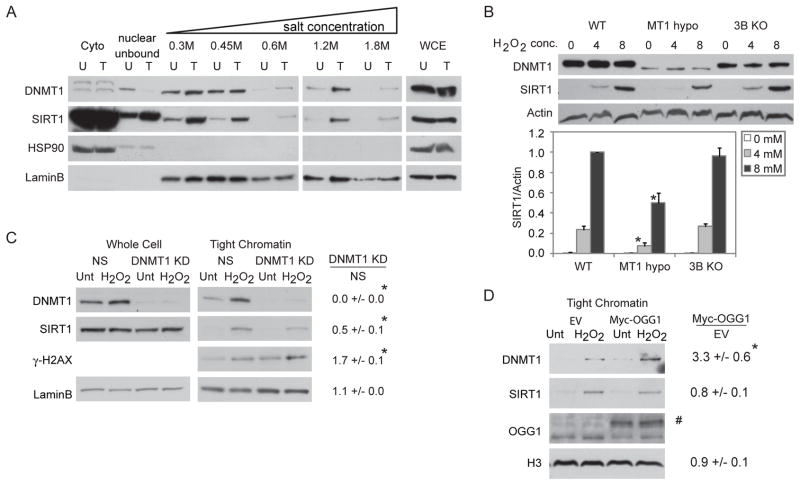
Figure 1. DNMT1 and SIRT1 Become Tightly Bound to Chromatin after Treatment with H2O2.
(A) NCCIT cells were untreated (U) or treated with 1 mM H2O2 for 30 minutes (T). Cell pellets were extracted sequentially using cytoplasmic extraction buffer (Cyto), soluble nuclear buffer (nuclear unbound), and buffers with increasing NaCl concentration. Whole cell lysates were prepared separately (WCE). (B) HCT116 (WT), HCT116 hypomorphic DNMT1 (MT1 hypo), and HCT116 DNMT3B KO (3B KO) cells were treated with H2O2 at the indicated concentrations in mM for 30 minutes and total nuclear protein was collected. y-axis is SIRT1 over Actin levels relative to 8 mM treated WT cells. The data presented is the mean of three independent experiments +/− SEM. * p < 0.05 by t-test. (C) NCCIT cells were infected with non-specific shRNA (NS) or DNMT1 shRNA. After 72 hours, they were untreated (Unt) or treated with 1 mM H2O2 for 30 minutes (H2O2). Tight chromatin is the remaining protein in the chromatin pellet after extraction with 0.45 M NaCl buffer. Band densitometry values are displayed as the ratio of DNMT1 knockdown over NS knockdown for protein levels in H2O2 treated cells. The data presented is the mean of three independent experiments +/− SEM. * p < 0.05 by one-tail t-test. (D) NCCIT cells were transiently transfected with empty vector (EV) or c-Myc-tagged OGG1 (Myc-OGG1) plasmids for 48 hours followed by 1 mM H2O2 treatment and analysis as in (C). # Myc-OGG1. * p < 0.05 by one-tail t-test. See also Figure S1.

