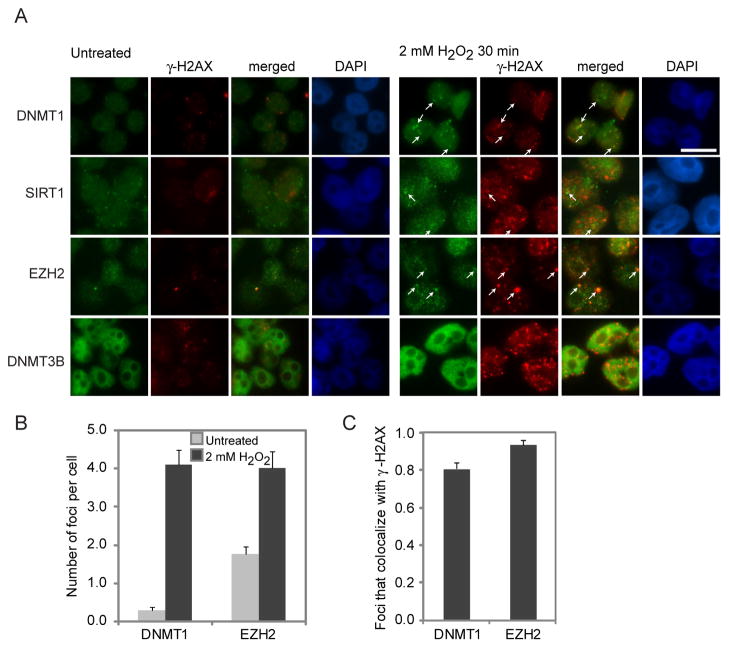
Figure 4. DNMT1 and EZH2 Form Nuclear Foci after H2O2 Treatment that Co-localize with γ-H2AX.
(A) NCCIT cells were untreated or treated with 2 mM H2O2 for 30 minutes. Immunofluorescence analysis was performed using the indicated antibodies. White arrows indicate examples of foci. White scale bar is 5 μm. (B) More than 50 nuclei from cells in (A) were scored per antibody in at least two independent experiments. Graphs represent the sample mean +/− SEM. Grey and black bars are untreated and H2O2 treated cells, respectively. (C) More than 50 nuclei from cells in (A) were scored per antibody in at least two independent experiments. Graphs represent the sample mean +/− SEM. Black bars are H2O2 treated cells. See also Figure S3.

