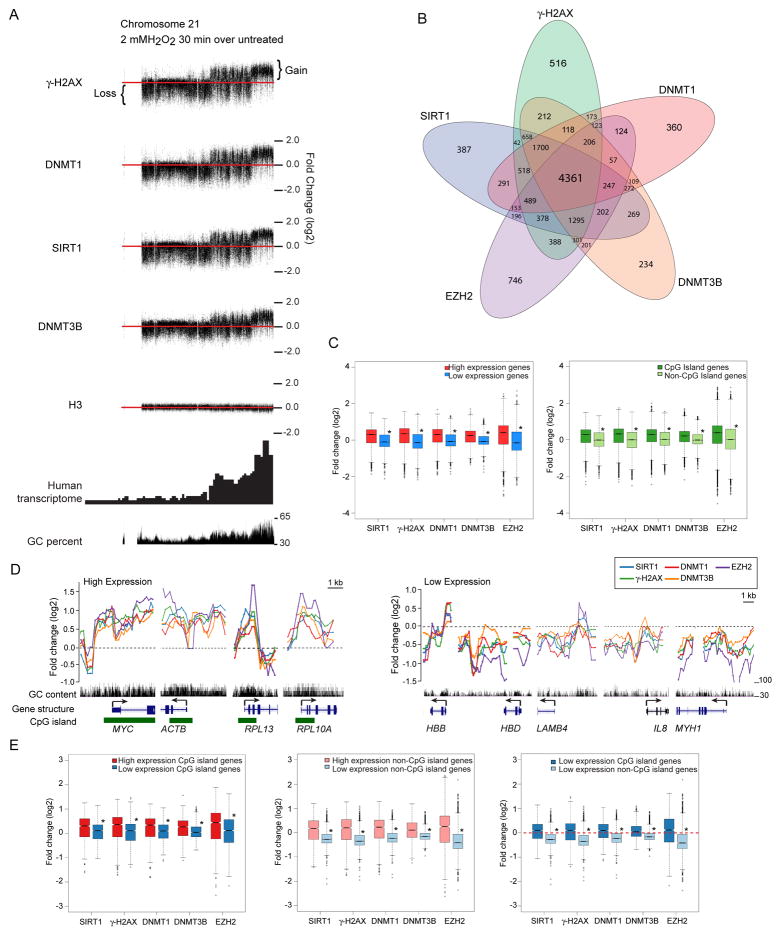
Figure 5. Oxidative Damage Induces Recruitment of Silencing Proteins to the Promoters of Actively Transcribed Genes and/or High GC Content Regions.
(A) SW480 cells were either untreated or treated with 2 mM H2O2 for 30 minutes, followed by ChIP-Chip using the whole chromosome array of chromosomes 18, 19, and 21. Differences in log2 ratios of IP signals over input signals between treated and untreated samples were plotted along chromosome 21. Red line represents the zero (no change) line. Signals above and below the red line represent gain and loss, respectively, of corresponding marker. (B) Venn diagram for ChIP enriched genes for each antibody in treated over untreated samples. SW480 cells were either untreated or treated with 2 mM H2O2 for 30 minutes. ChIP samples were hybridized to the 244K promoter array. (C) For box plots, the y-axis depicts the differences in log2 ratios of IP signals over input signals between treated and untreated samples. For the left panel, red and blue represent the top 1000 genes with high and low expression, respectively, from expression array data. In the right panel, dark and light green represent groups of CpG island and non-CpG island genes, respectively. * p < 2×10⁻¹⁰ by two-tail t-test. (D) Plots of ChIP-chip signals in treated over untreated samples for individual genes. y-axis is the same as in (C). Black dash line represents the no change line. Black vertical bars indicate GC content, ranging from 30% to 100%. Blue lines-boxes represent the position and construction of genes, with the boxes indicating the position of exons, lines indicating the position of introns, and arrow indicating the direction of transcription. Green boxes represent the position of CpG islands. The names of genes are indicated at the bottom of the plots. (E) Values were plotted as in (C). In the left panel, red and blue represent the top 100 CpG island genes with high and low expression, respectively. In the middle panel, pink and light blue represent the top 100 non-CpG island genes with high and low expression, respectively. In the right panel, blue and light blue represent the top 100 CpG island and non-CpG island genes, respectively, with similar levels of low expression. Red dash line represents the no change line. See also Figure S4.

