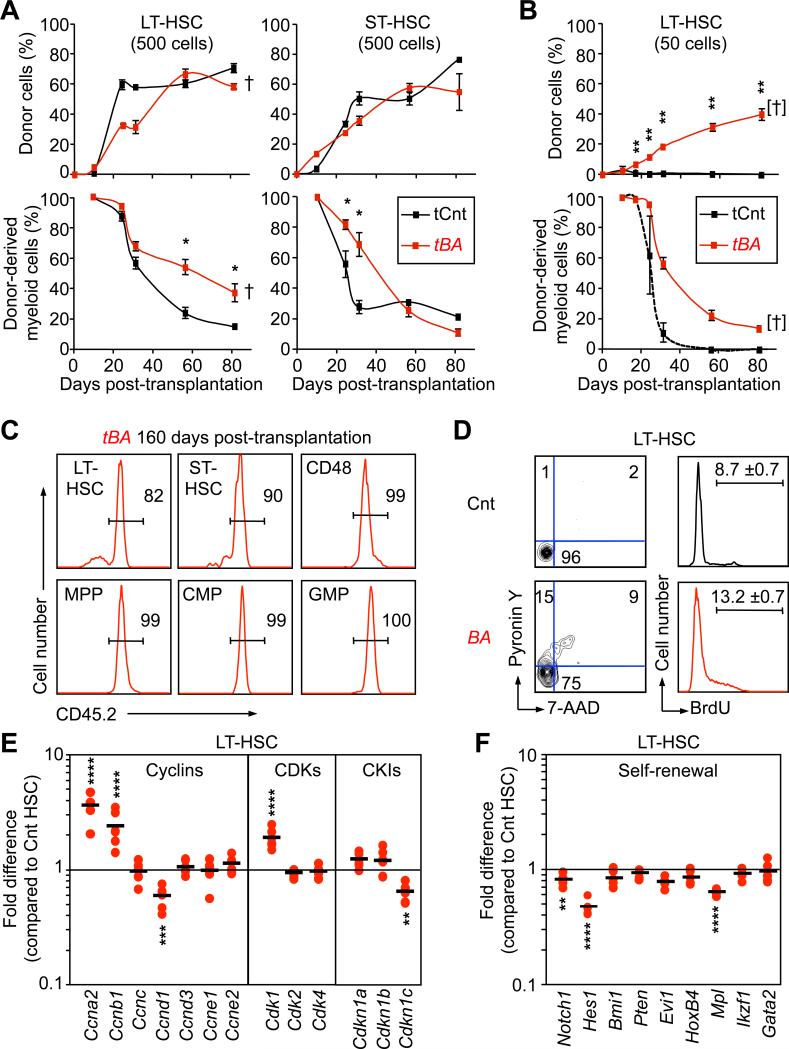
Figure 3. Functional and molecular characterization of CML leukemic stem cells.
(A) Leukemic potential of CML LT-HSCs and ST-HSCs. Cells were isolated from Cnt and BA mice (CD45.2) 5 weeks after doxycycline withdrawal and transplanted (500 cells/mouse) into sub-lethally irradiated recipients (CD45.1). Transplanted mice were bled at several time points and analyzed for overall percentage of CD45.2 chimerism (upper graphs) and percent of donor-derived Mac1+ myeloid cells (lower graphs). Results are expressed as mean ± SEM (n=2-3; *p≤5×10⁻²). † indicates cohorts found moribund.
(B) Limiting dilution transplantation. 50 Cnt or BA+ LT-HSCs (CD45.2) were transplanted into sub-lethally irradiated recipients (CD45.1) together with 3×10⁵ Sca-1-depleted BM cells (CD45.1). Graphs show kinetics of hematopoietic reconstitution in PB and results are expressed as mean ± SEM (n=7; **p≤10-3). [†] indicates cohort found moribund at later time points. (C) Clonal expansion analyses. The panels show representative examples of the percentage of CD45.2 chimerism in BM compartments 160 days after transplantation of 50 BA+ LT-HSCs.
(D) Cell-cycle analyses. LT-HSCs were isolated from Cnt and BA mice 5 weeks after doxycycline withdrawal. The left panels show DNA/RNA contents analyzed by 7-AAD and Pyronin Y (PY) staining, and the right panels shows BrdU incorporation in cells cultured for 1 hour with 60 μM BrdU. Results are expressed as mean ± SEM (n=2)
(E) and (F) Quantitative gene expression analyses. Pools of 100 Cnt and BA+ LT-HSCs were analyzed on a Fluidigm Dynamic Array IFC for a custom made set of cell cycle and self-renewal genes, respectively. Results are expressed as fold change relative to Cnt LT-HSCs (n=7; **p≤10-3, ***p≤10-4, **** p≤10-5).

