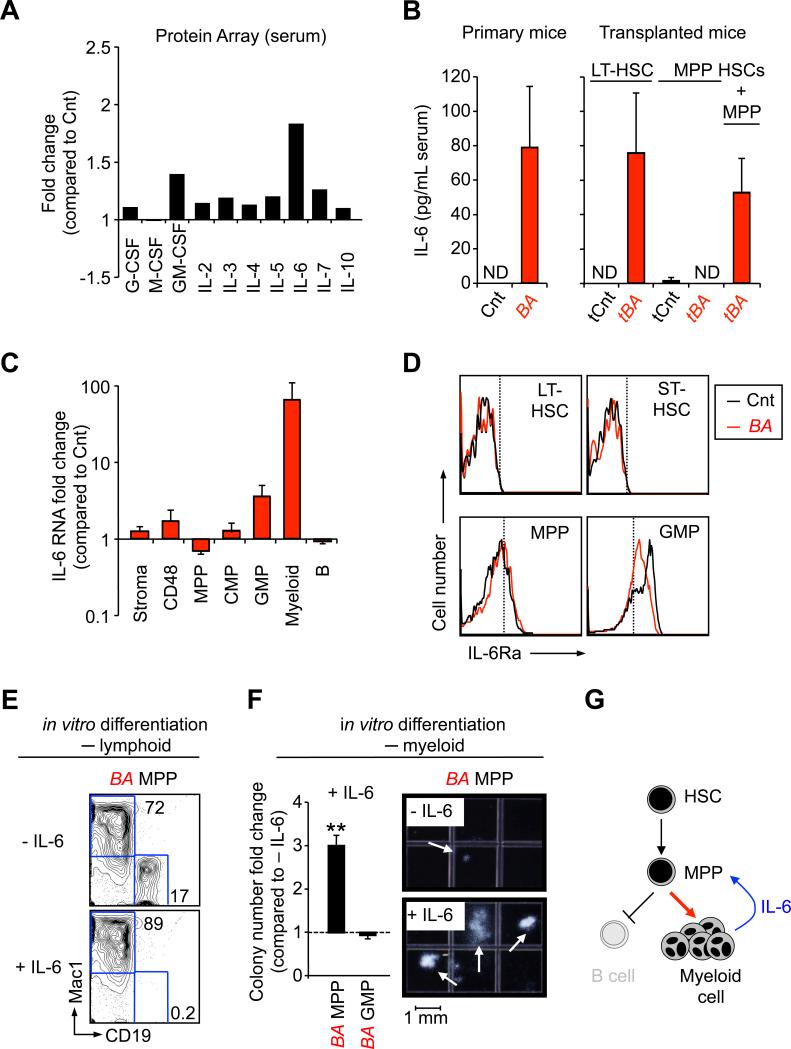
Figure 5. IL-6 paracrine loop.
(A) Pro-tumorigenic inflammatory environment during CML development. Changes in the indicated growth factors and interleukin levels were determined using an antibody-based protein array on pools of sera from 16 Cnt and 7 BA mice 6 weeks after doxycycline withdrawal. Results are expressed as fold change relative to levels measured in Cnt mice (set to 1).
(B) Modulation of serum IL-6 levels. ELISA measurement of IL-6 concentration in serum of individual Cnt and BA primary mice (left graphs), and mice transplanted with the indicated populations (right graphs). Results are expressed as mean ± SEM (n=2-6). ND stands for “not detectable”.
(C) qRT-PCR analysis of non-hematopoietic BM cells (stroma), CD48, MPP, CMP, GMP, mature myeloid and B cells for Il-6 mRNA levels. Results are expressed as mean ± SEM (n=3).
(D) Representative FACS histograms showing expression of the α-chain of IL-6 receptor on the indicated Cnt (black) and BA+ (red) populations. Dashed lines show isotype control negative boundaries. Data are representative of two independent experiments.
(E) Effect of IL-6 on lymphoid differentiation from BA+ MPPs. The FACS plots show a representative phenotypic analysis of CD19 (lymphoid) and Mac-1 (myeloid) markers after 8 days of in vitro culture (n=2).
(F) Differential effect of IL-6 on myeloid differentiation from BA+ MPPs and GMPs. The graph on the left show the fold changes in colony numbers when comparing conditions with or without IL-6 (set to 1). Results are expressed as mean ± SEM (n=2-3; **p≤5×10⁻⁴). The photographs on the right show representative myeloid colonies generated in both conditions from BA+ MPPs after 10 days of in vitro culture.
(G) Model describing the IL-6 paracrine loop in CML development identified in this study.

