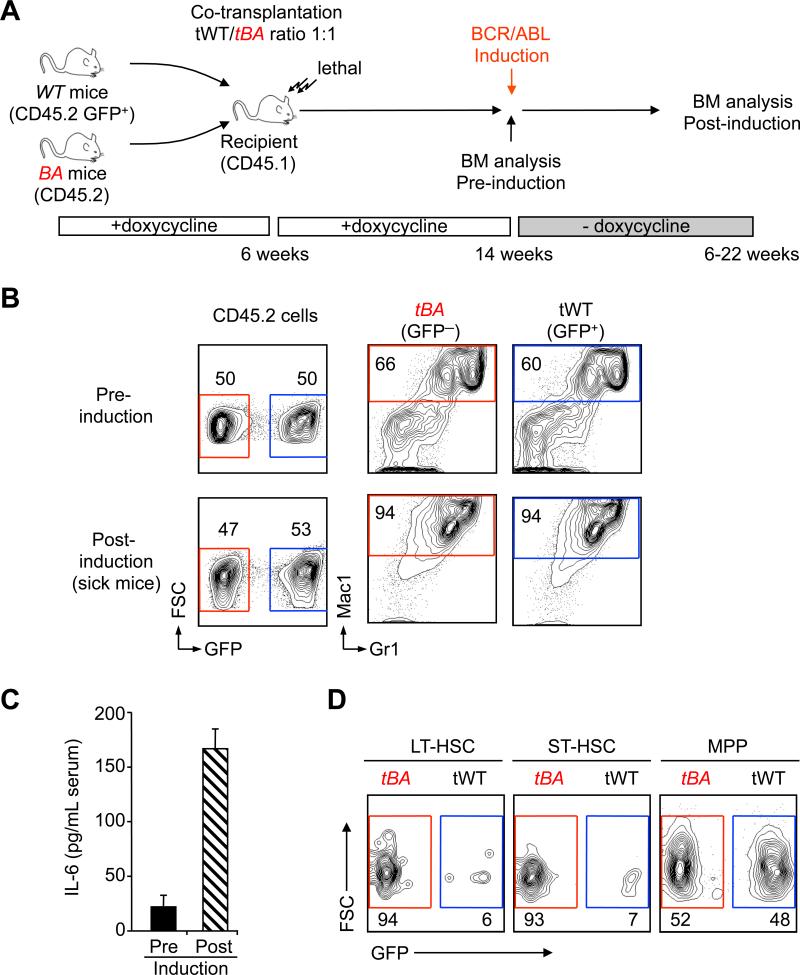
Figure 6. Contribution of IL-6 to lineage determination in vivo.
(A) Experimental scheme. 5×10⁶ wild type (tWT: CD45.2 GFP+) and 5×10⁶ non-induced BA+(CD45.2 GFP-) BM cells were co-transplanted into lethally irradiated recipients (CD45.1). Transplanted mice were maintained on doxycycline for 2 months to achieve stable reconstitution before inducing BA expression by doxycycline withdrawal. Mice were analyzed either pre or post BA-induction, when mice displayed signs of CML disease.
(B) Representative FACS plots showing contribution of tWT and tBA cells to the myeloid (Mac1+/Gr1+) BM output pre (top) and post (bottom) induction (n≥2).
(C) Concentration of IL-6 in the serum of transplanted mice pre and post induction. Results are expressed as mean ± SEM (n=2-4).
(D) Representative FACS plots showing contribution of tWT and tBA cells to the indicated BM compartments post induction (n=2).

