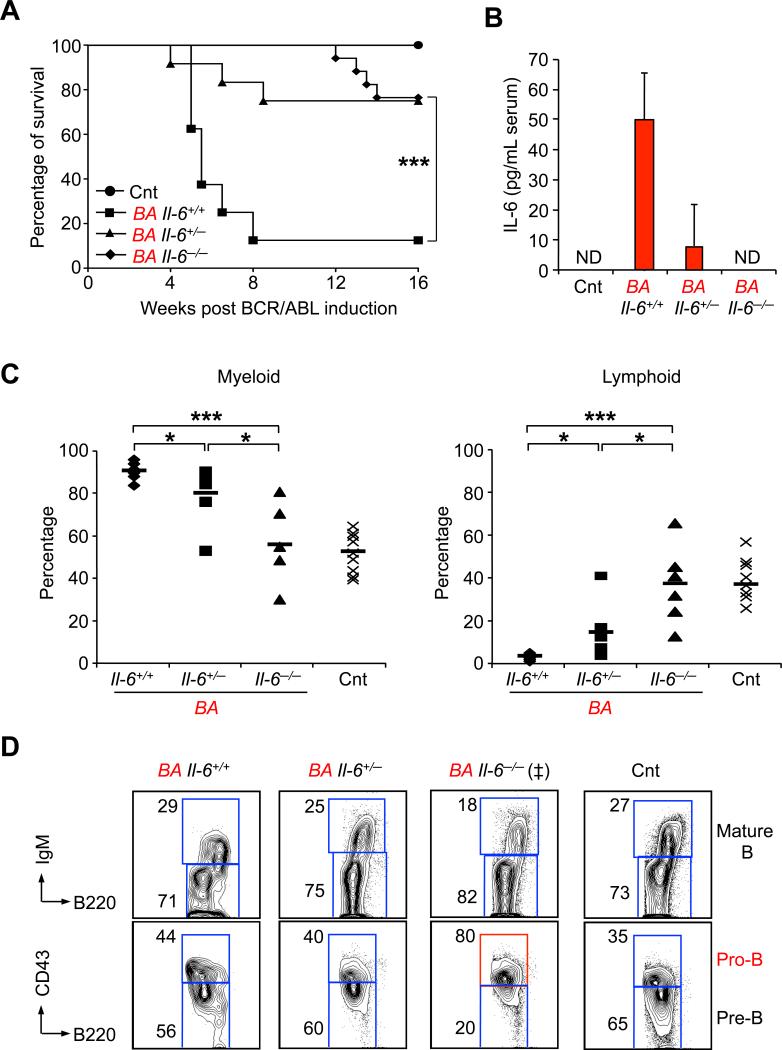
Figure 7. Role of IL-6 in CML development.
(A) Survival curve of Cnt (n=11) and Il-6+/+ (n=11), Il-6+/- (n=12) and Il-6-/- (n=17) BA mice after doxycyline withdrawal (*p≤ 5×10⁻²).
(B) ELISA measurement of serum IL-6 levels in Cnt and Il-6+/+, Il-6+/- and Il-6-/- BA mice. Results are expressed as mean ± SEM (n=7). ND stands for “not detectable”.
(C) Percentage of Mac1+ myeloid (left) and B220+ B-lymphoid (right) cells in BM of individual control and Il-6+/+, Il-6+/- and Il-6-/- BA mice (n=5-10; *p≤ 5×10⁻², ***p≤5×10⁻⁴).
(D) Representative FACS plots showing the phenotype of B cell progenitors generated in Cnt and Il-6+/+, Il-6+/- and Il-6-/- BA mice. (‡) indicates that FACS plots is representative of 3 out of 5 analyzed mice with this genotype.

