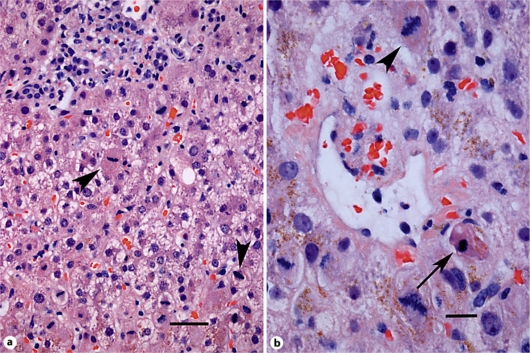
Fig. 1.
a Medium power light photomicrograph showing portal area (top) with mild inflammation, disarray and mitoses (arrowheads). Hematoxylin and eosin, ×200. Scale bar = 30 μm. b Higher power of small central vein and surrounding hepatocytes with mitoses (arrowhead) and apoptotic body (arrow). Hematoxylin and eosin, ×400. Scale bar = 15 μm.

