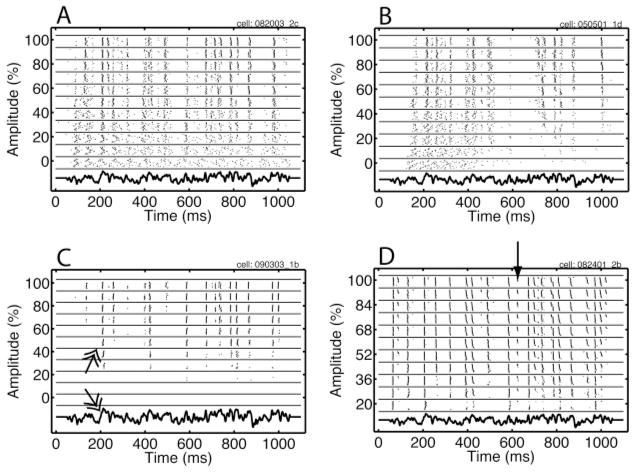
Figure 11.
Rastergrams obtained in response to injection of the same fluctuating current waveform for four different neurons. Each line in the rastergram represents a spike train obtained on a trial, with the x-ordinate of each tick being the spike time. The spike trains are ordered in blocks (delineated by horizontal lines) based on the amplitude of the injected current, expressed as a percentage, with the highest amplitude on top. Within each block, the trials are ordered as they were recorded, with the earliest trial at the bottom. The injected current is shown for a single amplitude at the bottom. Each panel shows the response of an example cell, the details of which are in the main text. The arrow indicates an example of nonstationarity; the double-headed arrow highlights a large depolarizing fluctuation and the corresponding event (see the text for details). The maximum amplitude (including online gain) in nA was 0.08, 0.05, 0.09, and 0.1, and the offset (again including online gain) was 0.12, 0.075, 0.1350, and 0.15, for panels A–D, respectively.

