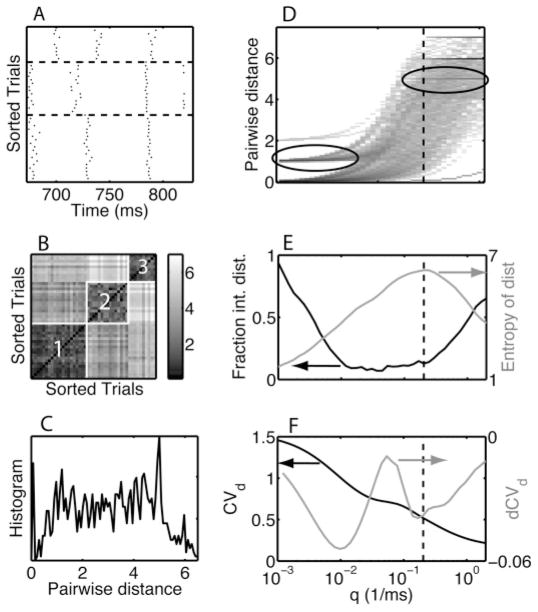
Figure 3.
Heuristic for selecting the temporal resolution parameter q. (A) Rastergram of 45 trials containing three patterns (separated by horizontal dashed lines). (B) The distance matrix for the below-determined q value. The matrix has a diagonal structure with blocks of small distance values corresponding to the patterns (as labeled by numbers inside the blocks). (C) The histogram of the matrix elements of the distance matrix shown in panel B. (D) Density plot of the distance distribution as a function of q. Each column represents a histogram just like the one shown in panel C, the location of which is indicated by a vertical dashed line. The ellipses highlight examples of enhanced density for integer values for the distance for small and large values of q. Panels D–F have a common x-axis scale, which is shown in panel F. (E) We show (black curve, left-hand-side scale) the fraction of distances within 0.05 from an integer and (gray curve, right-hand-side scale) the entropy of the distance histogram as a function of q. (F) We show (black curve, left-hand-side scale) the coefficient of variation of the distances (CVd) and (gray curve, right-hand-side scale) the differenced CVd (dCVd). The value of q is selected based on the peak of the entropy (panel E) and the first minimum following the peak of the dCVd (panel F). See the text for a detailed description of the heuristic procedure.

