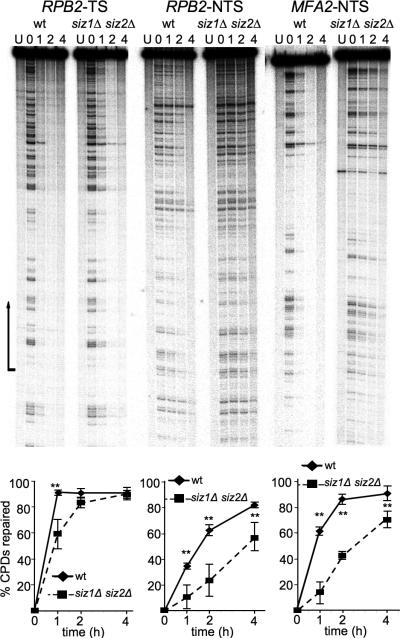
Fig. 3.
siz1Δ siz2Δ shows delayed repair of CPDs. (Top) Representative autoradiograms showing repair of the indicated strands of the indicated genes in wt and siz1Δ siz2Δ. Lanes are DNA samples from untreated cells (NT) and UV-irradiated cells following different times of repair incubation (hours) as indicated over each lane. Arrow indicates transcription start site and direction of transcription. For MFA2-NTS, the wt and siz1Δ siz2Δ samples were taken from different gels. (Bottom) Plots of CPD repair for the genes and strands shown above. For TS, the region of quantification included the entire transcribed region; for NTS, the whole gel was quantified. Error bars represent standard deviations of three independent experiments. Two asterisks represents p<0.01.

