
Fig. 3.
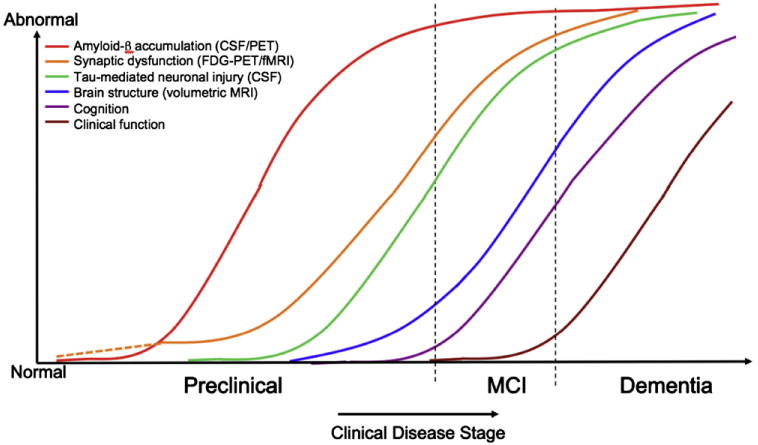
Hypothetical model of dynamic biomarkers of the AD expanded to explicate the preclinical phase: Aβ as identified by cerebrospinal fluid Aβ42 assay or PET amyloid imaging. Synaptic dysfunction evidenced by fluorodeoxyglucose (F18) positron emission tomography (FDG-PET) or functional magnetic resonance imaging (fMRI), with a dashed line to indicate that synaptic dysfunction may be detectable in carriers of the ε4 allele of the apolipoprotein E gene before detectable Aβ deposition. Neuronal injury is evidenced by cerebrospinal fluid tau or phospho-tau, brain structure is evidenced by structural magnetic resonance imaging. Biomarkers change from normal to maximally abnormal (y-axis) as a function of disease stage (x-axis). The temporal trajectory of two key indicators used to stage the disease clinically, cognitive and behavioral measures, and clinical function are also illustrated. Figure adapted with permission from Jack et al [22].