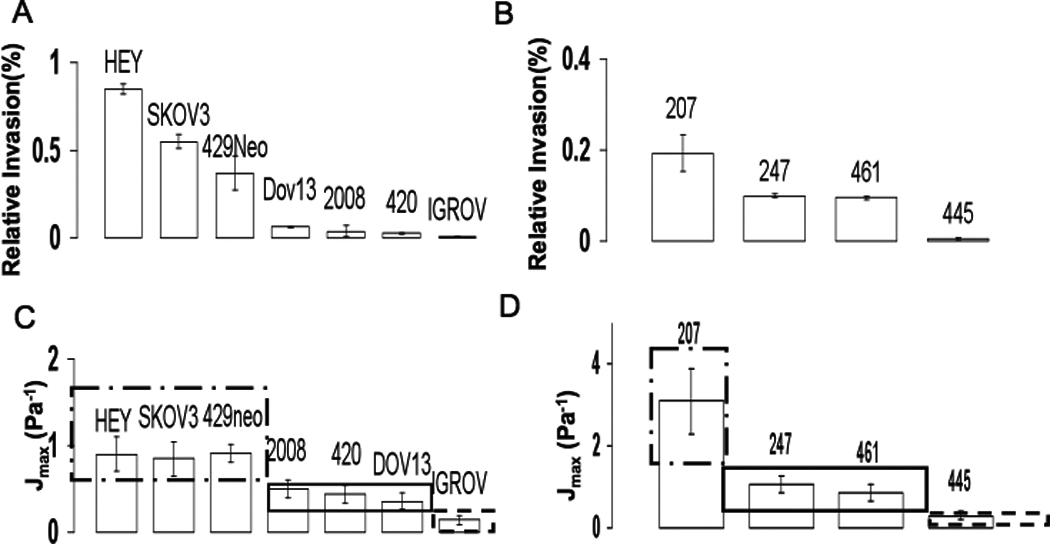
Figure 1. Invasive cancer cells have the highest compliance.

A) Invasion assays were performed on the indicated cancer cell lines (Methods) and percent invasion (I) relative to each other presented. Data represent the mean ± SEM of three independent experiments. B) Invasion of primary cancer cells as described in (A). C) Maximum compliance for all the cell lines is presented. The three boxes encompassed by dashed lines indicate the different scored regions based on relative invasion, with cell lines within a box not being statistically significant from each other mechanically (p≥0.05). (Dash dot box (--)- high invasion, I≥0.4, Solid box (-)- medium invasion, 0.2<I<0.4, dashed box (---) low invasion, I≤0.2). D) Maximum compliance for primary cancer cells is presented. The boxes separate statistically significant group of primaries similar to (C). All mechanical measurements represent mean± SEM.
