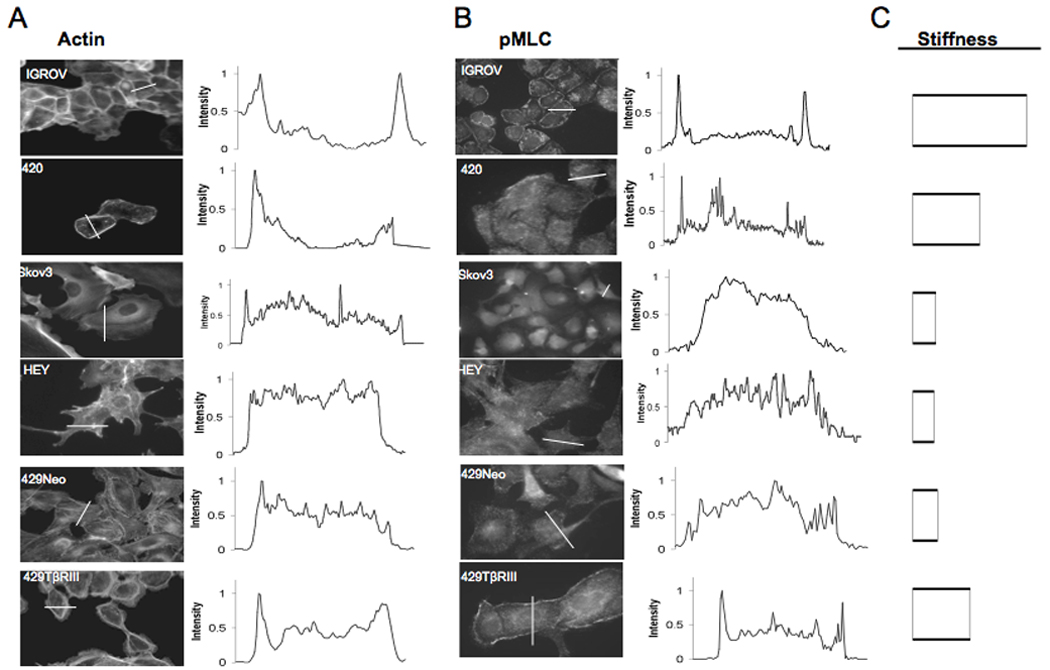
Figure 3. Highly invasive and stiff cancer cells express cortical actin and myosin.

Immunoflourescence images of cells stained either for (A) actin using rhodamine conjugated to phalloidin or with an antibody to (B) phosphorylated myosin light chain (pMLC). Quantification of fluorescence intensity using Image J software across the lines shown in the corresponding panels on the left are indicative of stress fiber density in the case of actin or cortical pMLC localization. C) Stiffness of the respective ovarian cancer cell lines.
