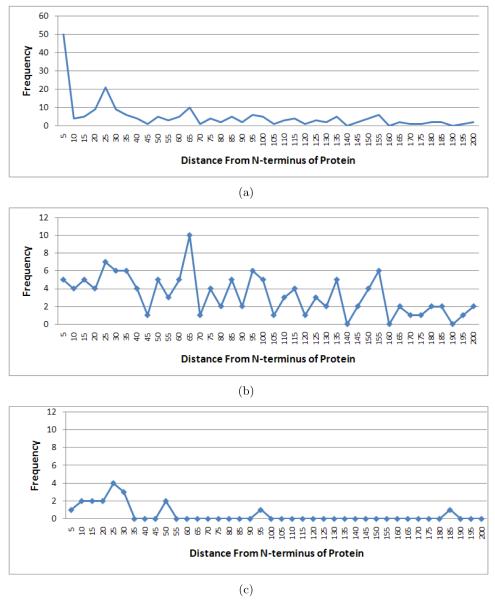
Figure 5.
(a) The histogram of positions in the corresponding protein sequence of the proteolytic sites in Supplementary Table 5. A bin size of 5 is used in the construction of histogram, and the plot is truncated at position 200 for brevity. (b) Similar plot as in (a), after removing the sites at second positions of proteins (NME) and those predicted as signal peptide cleavage sites by SignalP. (c) Similar plot as in (b), but keeping only the most upstream peptide detected in a protein (to infer N-terminal proteolytic events like NME or signal peptide cleavage [28]).

