
Figure 3.
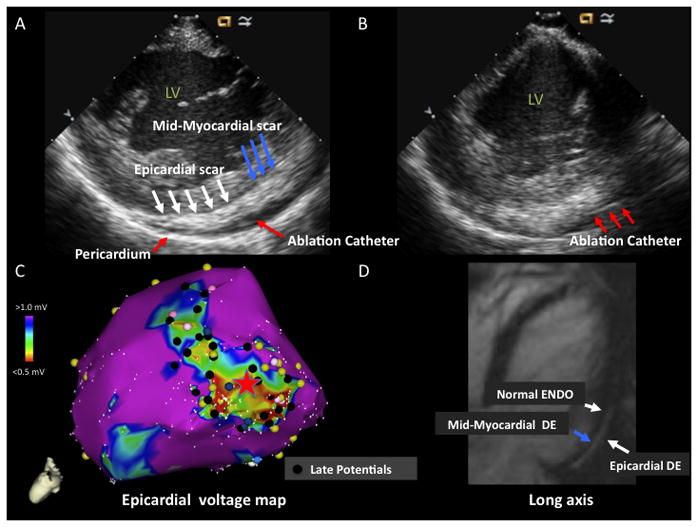
A) ICE image with increased echogenicity in epicardium (white arrows) and mid-myocardium (blue arrows) identified on posterolateral wall. Pericardium is marked by red arrow. Ablation catheter in pericardial space is marked by red arrow. B) ICE image with ablation catheter (red arrows) in pericardial space with catheter tip adjacent to area of mid-myocardial/epicardial echogenicity. C) LV epicardial voltage map with area of low voltage on the posterolateral wall. The red star marks the location of the catheter tip on the epicardial voltage map that is seen on the ICE image in panel B. Late potentials are denoted by black tags. D) MRI image (long axis) with extensive areas of delayed enhancement (DE) in epicardium (white arrow) and mid-myocardium (blue arrow). Normal endocardium (white arrow) is noted. LV = left ventricle, ENDO = endocardium, EPI = epicardium