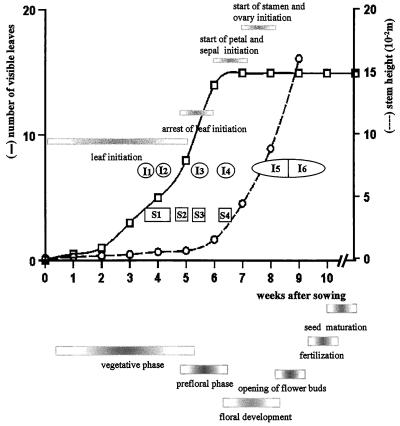
Figure 1.
Summary of the main parameters of vegetative and reproductive development of the tobacco var Petit Havana cv SR1. The number of visible leaves and the stem height were recorded starting with an interval of 1 week, and were plotted against the number of weeks after sowing. Sampling points for both cytokinin quantification (S1–S4) and for immunolocalization of cytokinin bases (I1–I6) are located in the graph. The horizontal bars in the graph indicate the different morphogenetic events at the apical shoot meristem. The horizontal bars under the graph indicate the different phases of plant development.

