
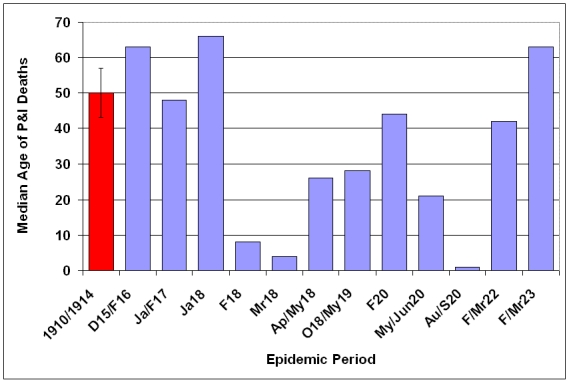
Figure 12: Median age at death attributable to P&I for epidemic periods 1915-1923. Median age at death and 95% confidence interval for mean median age at death due to P&I for years 1910-1914 is represented by red bar at the far left of the graph.
Official websites use .gov
A
.gov website belongs to an official
government organization in the United States.
Secure .gov websites use HTTPS
A lock (
) or https:// means you've safely
connected to the .gov website. Share sensitive
information only on official, secure websites.
Figure 12: Median age at death attributable to P&I for epidemic periods 1915-1923. Median age at death and 95% confidence interval for mean median age at death due to P&I for years 1910-1914 is represented by red bar at the far left of the graph.