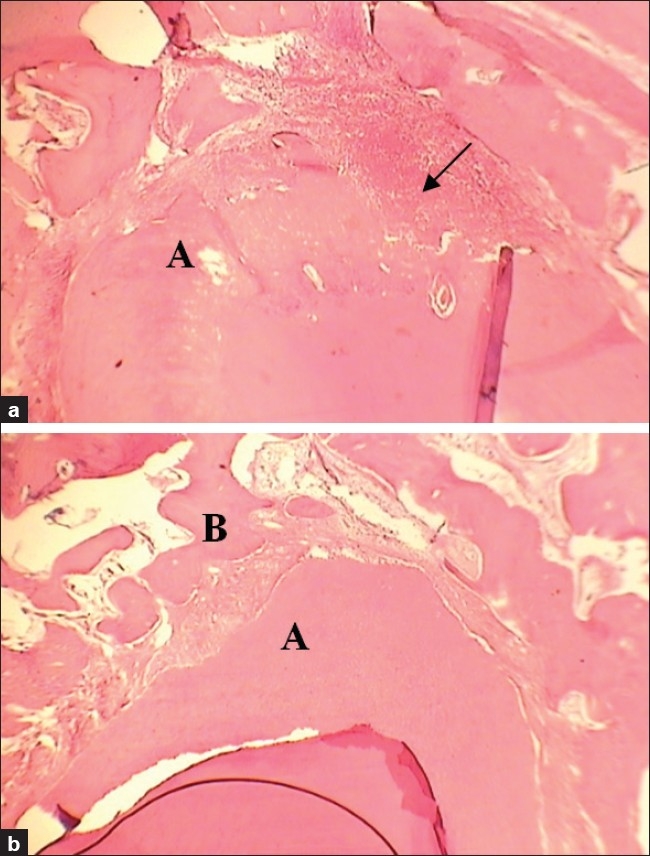
Figure 1.

(a) Histological view of the control group showing severe infiltration of inflammatory cells and apical resorption (arrow) corresponding to healing score 1.00 (H and E: ×100). (b) Histological view of the AG group showing minimal inflammatory cells, bone formation, and fibrous connective tissue formation corresponding to healing score 3.00 (H and E: ×100). A: Apex B: Bone
