
Figure 7.
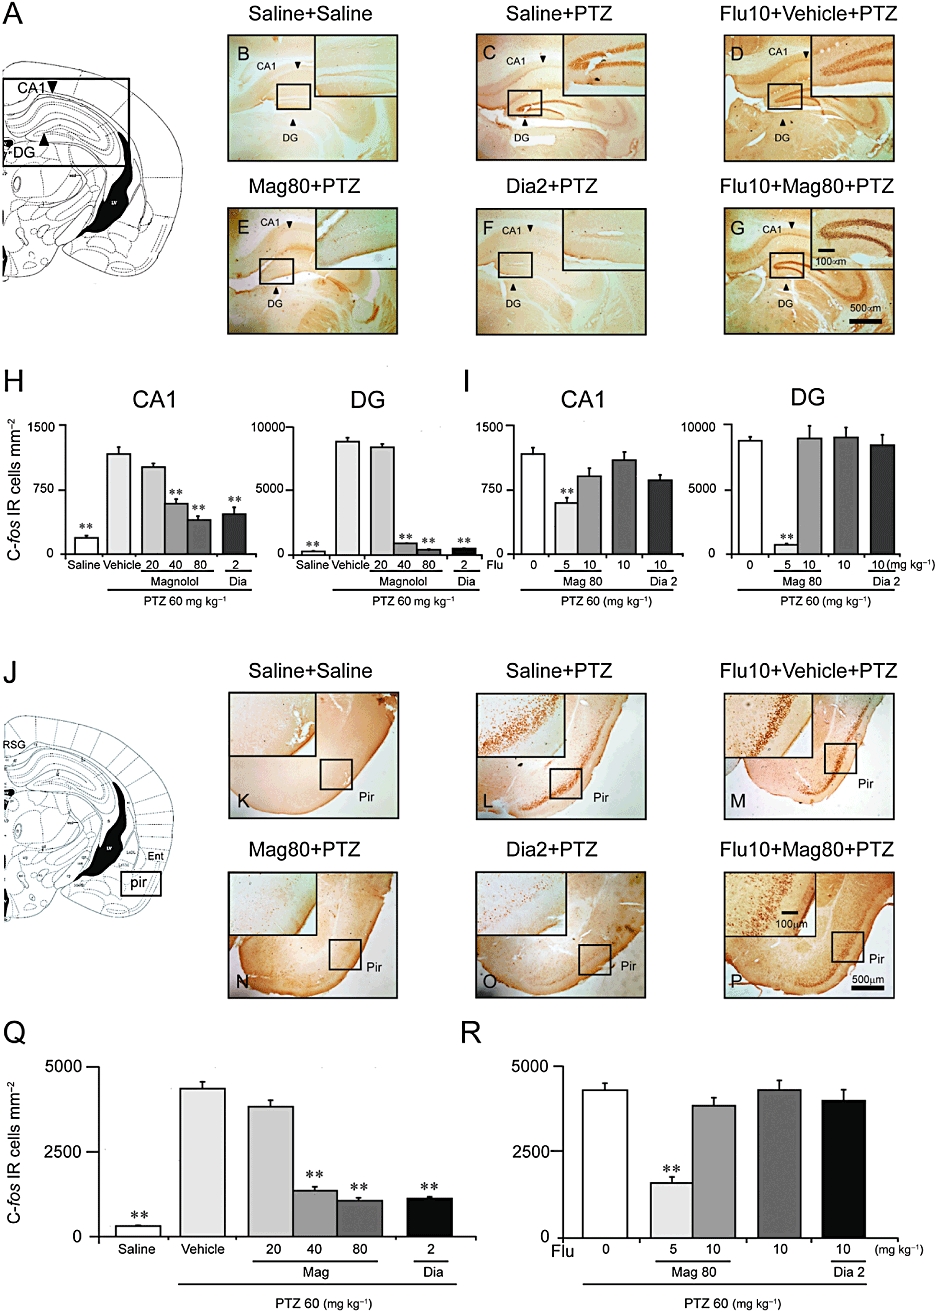
Magnolol (Mag) decreased Fos-positive cells in the hippocampus and piriform cortex (Pir) induced by PTZ 60 mg·kg−1. (A, J) Composite drawing of representative coronal sections was taken at the level of hippocampus and piriform cortex respectively (Paxinos and Watson, 1986). (B, K) Low- and high-power photomicrographs representative of the hippocampus area and piriform cortex, respectively, in which Fos-positive cells were counted. There were only a few Fos-positive cells in the saline group. (C, L) The number of Fos-positive cells in the CA1 and dentate gyrus (DG) parts (arrows) of the hippocampus and in the piriform cortex was high in the vehicle group. (D, M) Pretreatment with flumazenil (Flu) at 10 mg·kg−1 did not influence Fos expression in the CA1 and dentate gyrus (DG) parts (arrows) of the hippocampus or in the piriform cortex induced by PTZ. Magnolol at 80 mg·kg−1 (E, N) and diazepam (Dia) at 2 mg·kg−1 (F, O) significantly decreased the number of Fos-positive cells; positive cell staining was not visible in the DG, and only a few Fos-positive cells were seen in the piriform cortex. (G, P) Flumazenil at 10 mg·kg−1 blocked the decrease in the number of Fos-positive cells in the hippocampus and piriform cortex caused by magnolol at 80 mg·kg−1. (H, Q) Mean number of Fos-positive cells in CA1, DG and in the piriform cortex of saline-, vehicle-, magnolol- and diazepam-treated groups respectively. (I, R) Mean number of Fos-positive cells in CA1, DG and in the piriform cortex of flumazenil (0, 5, 10 mg·kg−1)-pretreated groups. Flumazenil at 5, 10 mg·kg−1 dose-dependently blocked the decrease in the number of Fos-positive cells in the hippocampus and piriform cortex caused by magnolol (Mag; 80 mg·kg−1) or diazepam (2 mg·kg−1). Each value represents the mean ± SEM (n = 6–9). **P < 0.01, significantly different from the vehicle group.