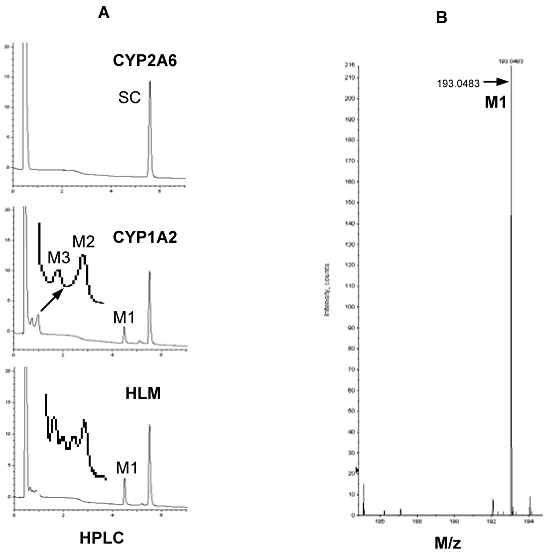
Figure 5.

Analysis of SC metabolism by HPLC and mass spectrometry. (A) Metabolic profiles analysed by HPLC: SC (20 µM) was incubated with a CYP (1 pmol), or pooled human liver microsomes (20 µg) in a total volume of 100 µL in the presence or absence of the NADPH-regenerating system (NRS) and incubated at the same temperature for 60 min. The reactions were typically terminated by addition of 200 µL ice- cold acetonitrile and precipitated protein was removed by centrifugation (12 000×g for 15 min at 4°C). The metabolism was monitored by HPLC (Hitach-Elite LaChrom) with a Chromolith SpeedROD column RP-18e. The metabolic profiles were monitored by a diode array detector at 323 nm. (B) Analysis of purified M1 by mass spectrometry. The chemical identity of purified metabolite (M1) was determined in 60:40 acetonitrile by LC-MS.
