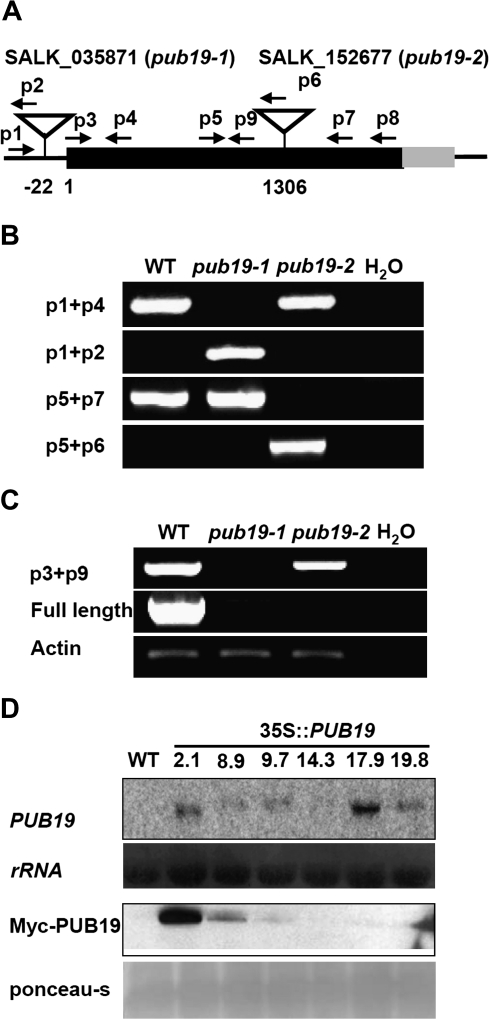
Figure 3.
Molecular Characterization of the pub19 Mutant Lines and AtPUB19-Overexpressing Transgenic Plants.
(A) Schematic of the AtPUB19 depicting the positions of T-DNA insertions shown as inverted triangles. Arrows indicate the positions of primers used in separate genomic PCR or RT–PCR.
(B) Genomic PCR analysis of WT, pub19-1, and pub19-2 plants. DNA was isolated from 10-day-old seedlings. In this experiment, four different primer sets were used as indicated on the right.
(C) RT–PCR analysis of WT, pub19-1, and pub19-2 plants. RNA was isolated from 2-week-old seedlings treated with 300 mM NaCl.
(D) AtPUB19 transcript and protein levels in transgenic lines. Western blot was performed using an anti-Myc monoclonal antibody.

