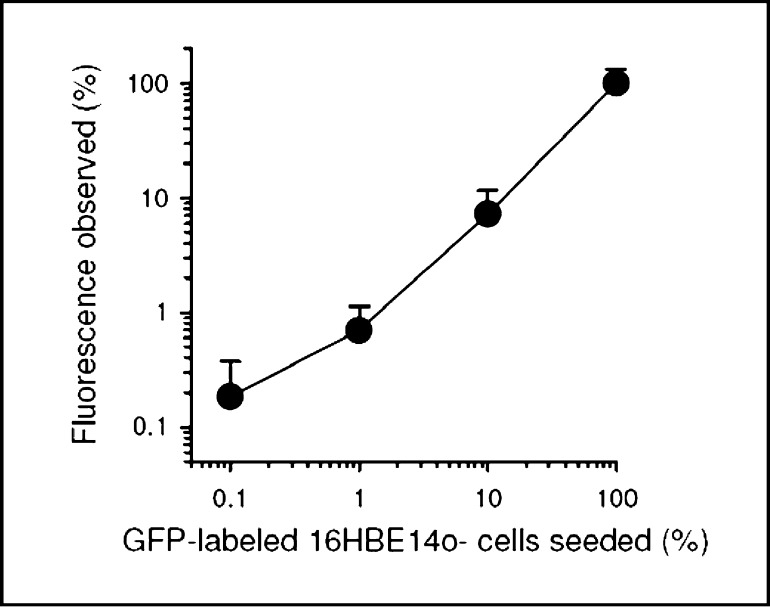
Fig. 3.
Analysis of GFP-fluorescence observed in mixed CFBE410- and 16HBE14o-monolayers. Fluorescence was quantified in images shown in Fig. 2F-J and plotted as a function of the percentage of the GFP-labeled 16HBE14o- cells seeded. Observed fluorescence above background is expressed as the fluorescence relative to that obtained from monolayers of pure 16HBE140- cells (=100%) expressing GFP. Note log-log scaling. Correlation is significant, p=0.001, r=0.99, slope=0.92±0.09.

