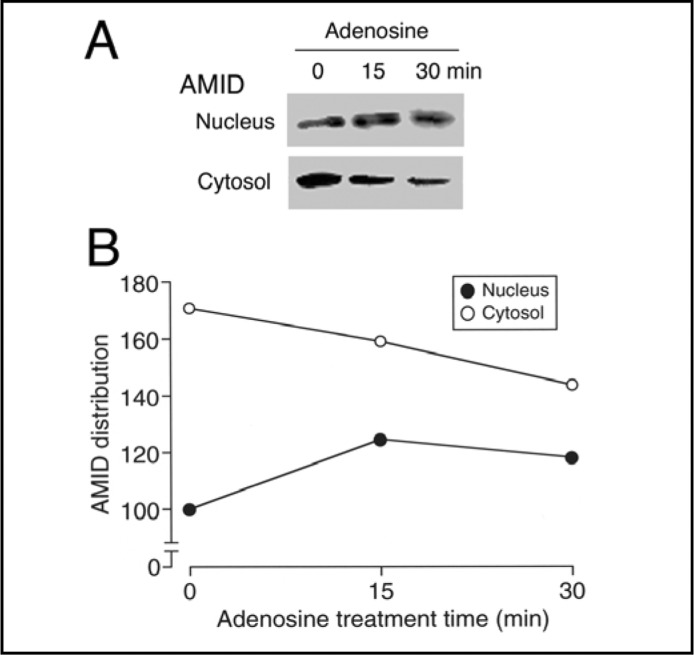
Fig. 5.
Intracellular distribution of AMID. HuH-7 cells, before and after treatment with adenosine (10 mM) for times as indicated, were separated into the cytosolic and nuclear components followed by Western blotting using an anti-AMID antibody (A). (B) In the graph, each point represents the relative AMID signal intensity against the intensity in the nuclear component at 0 min as 100. Note that similar results were obtained with 4 independent experiments.

