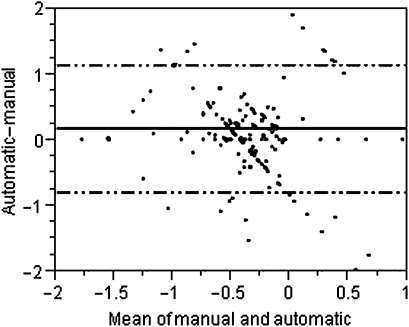
Figure 3.
Bland–Altman plot of predictive mortality coefficient on manual and automatic calculation in the validation cohort. The correlation between manual and automatic model coding of the predictive mortality coefficient was less than it was in the derivation cohort (r2, mean square error=0.42, 0.423).

