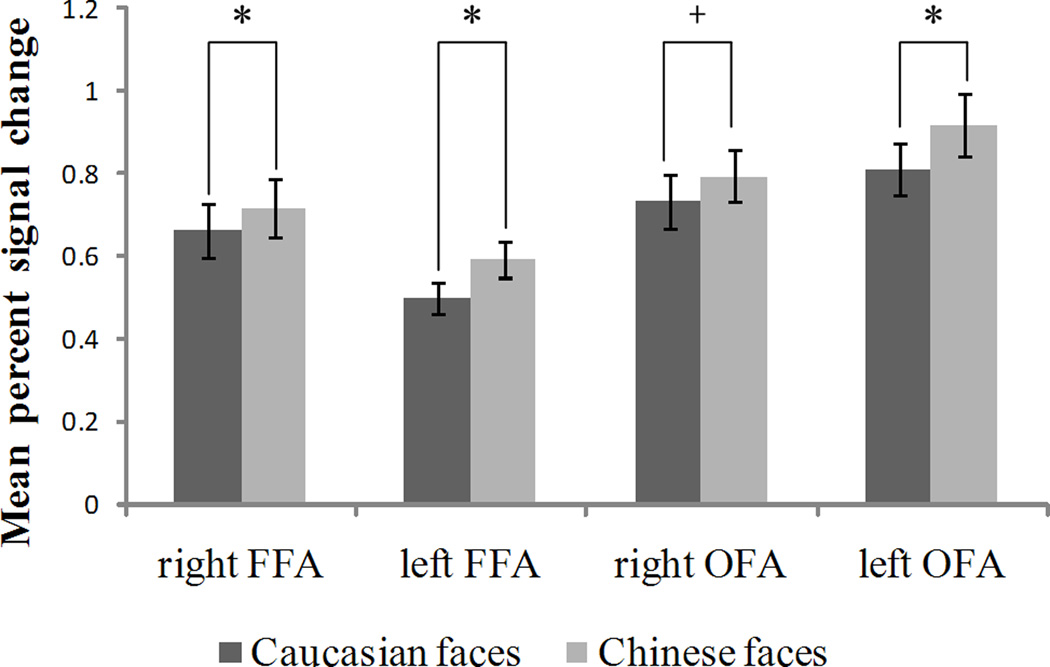
Figure 2.
Results of the ROI analyses. Mean percent signal changes within the bilateral fusiform face areas (FFA) and the occipital face areas (OFA) when categorizing own-race (Chinese) and other-race (Caucasian) faces are shown with their SEMs. The symbol “*” indicates the difference between the two conditions is significant at the 0.05 level, while the symbol “+” indicates the difference between two conditions is marginally significant (p = .057). The MNI coordinates for right FFA, left FFA, right OFA, left OFA separately are (42±4, −50±7, −19±5), (−40±2, −53±7, −21±6), (39±7, −77±6, −13±5), (−38±6, −78±7, −13±7).

