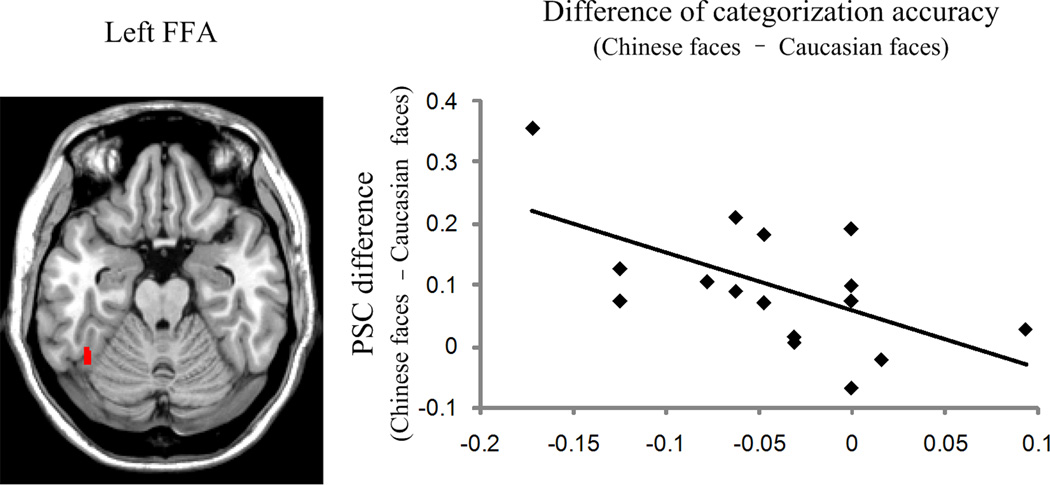
Figure 3.
Correlation between behavioral difference of own- and other-race face categorization accuracy and the left FFA’s response to own-race faces versus other-race faces. The location of the left FFA from one participant is shown on an axial slice. The scatter plot demonstrates a negative correlation between PSC differences (PSC of own-race – PSC of other-race) and differences in the categorization accuracy (accuracy of own-race – accuracy of other-race) for 17 participants whose FFAs can be identified (r = −.594).

