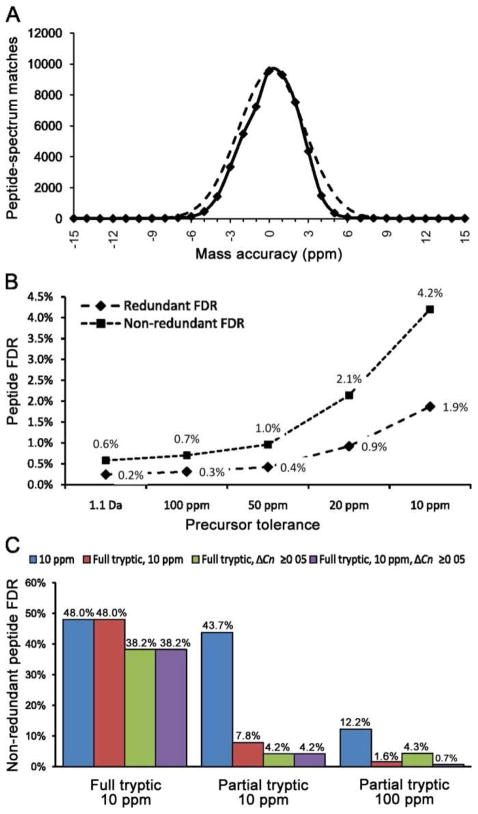
Figure 6. Determining optimal precursor mass tolerance and post-search mass accuracy filter.
An ovarian tumor secretome dataset was used to test different precursor mass tolerances and mass accuracy filter combinations. (A) Distribution of PSM mass accuracy for very high confident matches (solid line) with a superimposed normal distribution (dashed line). (B) Relationship between precursor mass tolerance and peptide FDR using a constant post-search filter. (C) Comparison of peptide FDR using different post-search filters with full tryptic/10 ppm, or partial tryptic/10 ppm, or partial tryptic/100 ppm searches.

