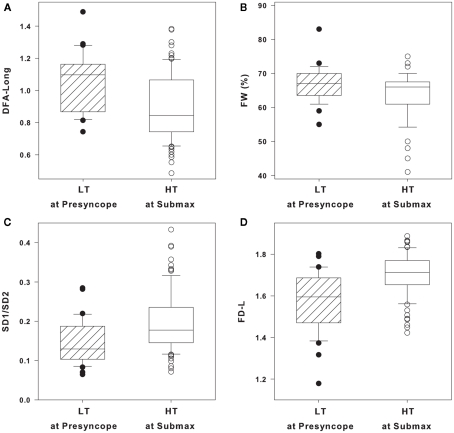
Figure 3.
(A) Long-range detrended fluctuation analysis (DFA long), (B) forbidden words (FW), (C) Poincare plot standard deviations ratio (SD1/SD2), and (D) fractal dimensions by curve length (FD-L) in low tolerant (LT) at presyncope (solid circles, n = 33) and high tolerant (HT) at submax (open circles, n = 87) level of lower body negative pressure (LBNP). Data are shown as box (25th/75th percentiles) and whisker (90th/10th percentiles) plots with median value (black line).

