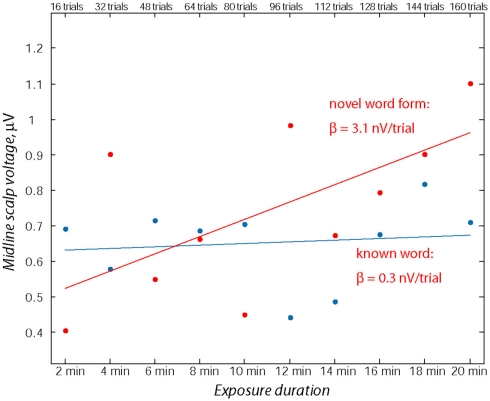
Figure 4.
Assessment of ERP magnitude change through the exposure session using linear regression over consecutive 10% sub-blocks. Note the relative stability of the word response in contrast with the marked increase in the pseudo-word response amplitude. Data from both time windows (70–90 and 110–130 ms) from midline electrodes (Fz, FCz) were used for computing linear regression for each participant’s responses to known words and novel pseudo-words.

