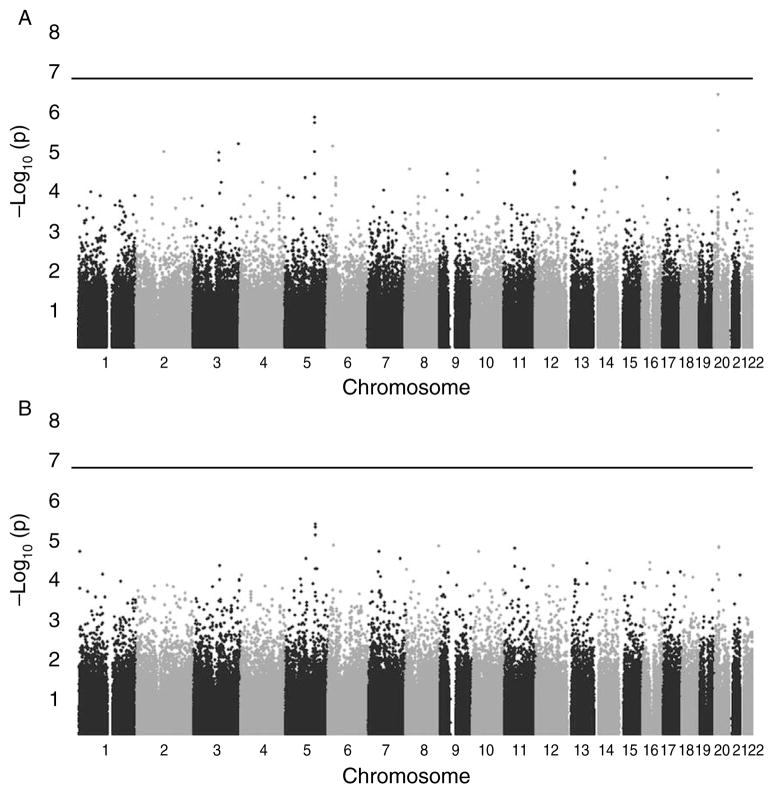
Figure 1.
Distribution of P values for the SNPs in a genome-wide association study of ileal carcinoid cancer. (A) P values for the 1 d.f. allelic test of association. (B) P values for the 2 d.f. genotypic test of association. P values are plotted as the −log10(P), with the SNPs in chromosomal order along the x-axis. The horizontal line indicates the Bonferroni-adjusted threshold for significant association at the 0.05 level.

