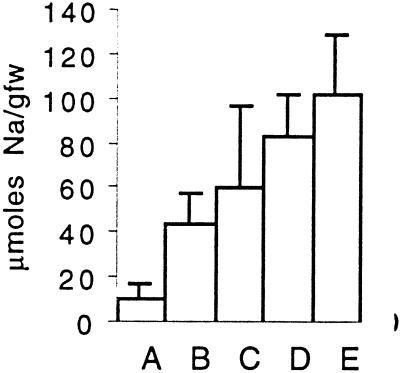
Figure 4.
Titration of inositol concentration in its effect on sodium uptake. Analysis of sodium in leaves of hydroponically grown 2-week-old seedlings treated for 3 d (n = 5 for each treatment). Treatments consisted of the following: A, Control; B, 100 mm NaCl; C, 100 mm NaCl plus 0.1 mm myo-inositol; D, 100 mm NaCl plus 0.3 mm myo-inositol; E, 100 mm NaCl plus 1.0 mm myo-inositol. gfw, Grams fresh weight. Results are means ± sd.

