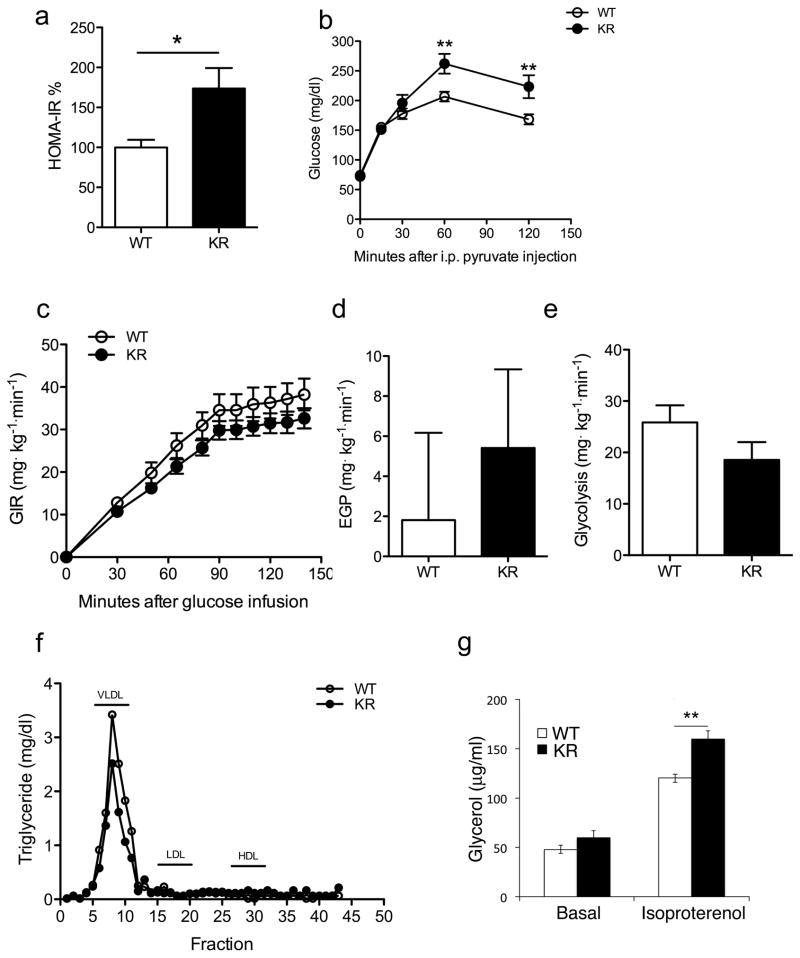
Figure 3. Metabolic data in Foxo1KR/KR mice.
(A) HOMA-IR values calculated from the data in Table S2. (B) Pyruvate tolerance tests in WT and Foxo1KR/KR mice. (C) Glucose infusion rates, (D) Endogenous glucose production under hyperinsulinemic conditions, and (E) Glycolysis during euglycemic hyperinsulinemic clamps. (F) Determination of TG content in lipoprotein fractions isolated by FPLC analysis. (G) Basal and isoproterenol-stimulated glycerol release from primary cultures of epididymal fat pads. n= ≥ 6 mice per group and each experiment. *= P<0.05; ** =P<0.01 by 2-way ANOVA. Data are presented as means ± SEM.

