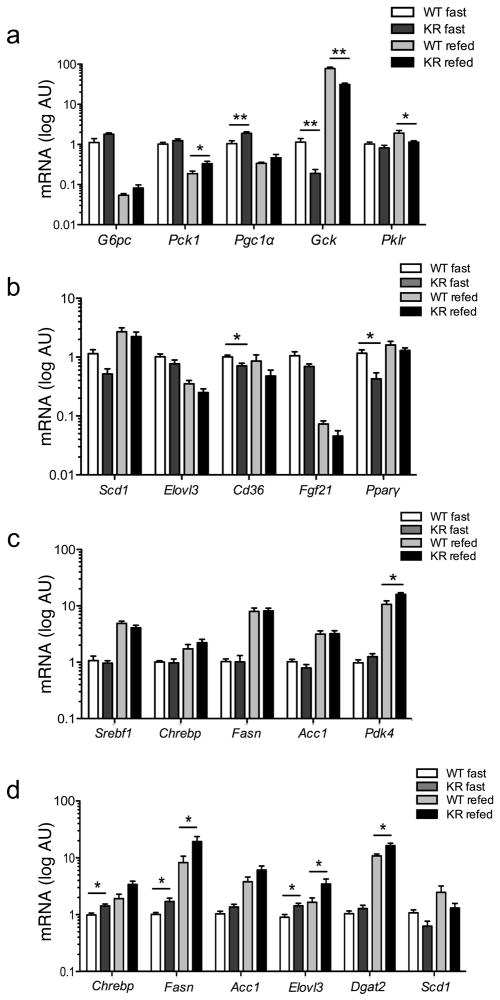
Figure 4. Gene expression analysis.
(A)Hepatic expression of genes involved in glucose and (B, C) lipid metabolism in 2-month-old male mice. (D) Adipose expression of fatty acid and TG synthetic genes in the same cohort. n = ≥ 6 for each genotype. *=P<0.05, **=P<0.01 by Student’s t-test. Data are presented as means ± SEM.

