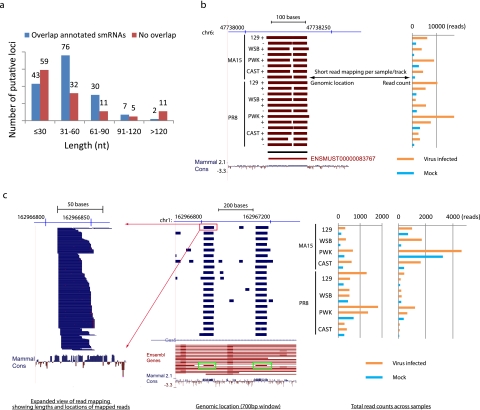
FIG 3 .
Length distributions of identified putative small RNA loci and two examples of non-miRNA small RNAs differentially expressed during SARS-CoV and influenza virus infection. (a) The length distribution of the identified putative small RNA loci. Data for “overlap annotated smRNAs” represent loci overlapping annotated or predicted small RNAs, including miRNAs, snoRNAs, piRNAs, and RNA repeats. “No overlap” data represent loci that do not overlap any small RNAs. (b) UCSC genome browser (http://genome.ucsc.edu) display of the locations of reads mapped to a 350-bp region of chromosome 6 (chr6). On the left, each track represents short reads collected from small RNA transcriptome sequencing analysis of a single mouse lung sample. Because there were too many reads to be displayed individually, total reads were condensed (dense mode) to display the genomic regions with mapped reads. The red color indicates that the reads were mapped to the negative strand. The black horizontal bar under the sample tracks shows the location of the predicted small RNA locus. The red horizontal bar represents a Y RNA, a small noncoding RNA component of the Ro ribonucleoprotein particle, as annotated by the use of Ensembl software. The raw total read counts of the corresponding small RNA locus across all 20 samples are represented on the right in the same order as shown on the left. Read counts indicate that expression of the small RNA was upregulated during virus infection. Mammal cons, UCSC track (http://genome.ucsc.edu) showing the placental mammal basewise conservation by PhyloP. (c) An overview similar to that shown in panel b for a 700-bp region of chromosome 1 covering two predicted small RNA loci. Each track represents a condensation of the short reads from a single sample (middle panel). The blue color indicates the reads were mapped to the positive strand. Green boxes show two predicted small RNA loci overlapped with two snoRNAs (the red horizontal bar inside each green box) annotated by the use of Ensembl software (version 61) and located in the introns of Gas5, a known long ncRNA located on the positive strand. Different isoforms of Gas5 are shown on the track labeled Ensembl Genes. An expanded view of the read mapping highlighted by the red box is displayed on the left. Distributions of the lengths and mapped locations of short reads from the single sample are shown. Raw read counts of two corresponding small RNA loci across all 20 samples are shown on the right (in the same order as shown in the middle panel). Both small RNA loci were upregulated during SARS-CoV and influenza virus infection.

