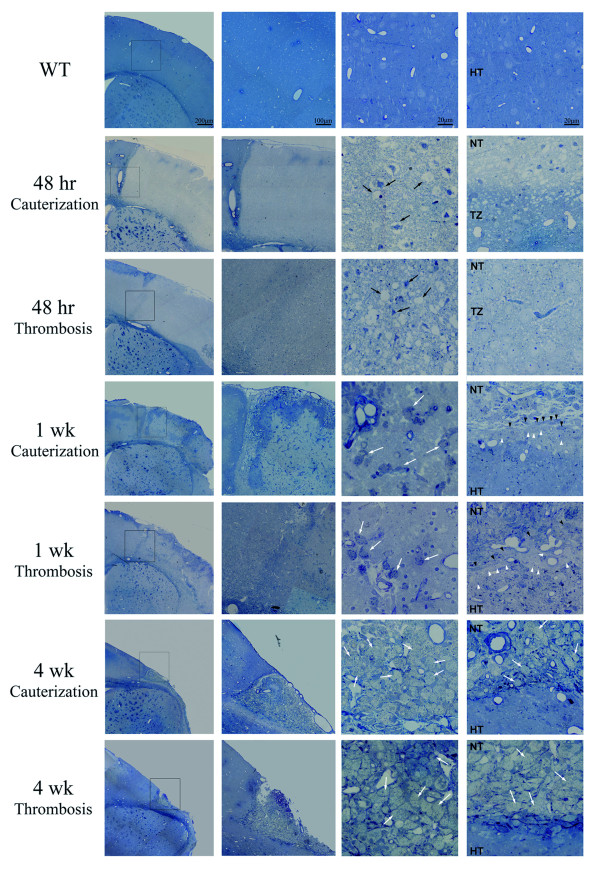
Figure 2.
Damage evolution and glial scar formation in cauterization and thrombosis models. Photomicrographs of toluidine blue-stained semithin-sections at different time points after stroke. For each time point the first picture represents a panoramic view of the whole hemisphere. The area squared in this picture is depicted next at higher magnification. The last two represent details of the necrotic area and the boundary ischemic zone. Black arrows point piknotic cells and cellular ghosts. White arrows point to macrophages. Black arrowheads point to elongated cells and white arrows point to voluminous non-macrophage cells (TZ: transition zone; HT: healthy tissue; NT: necrotic tissue).

