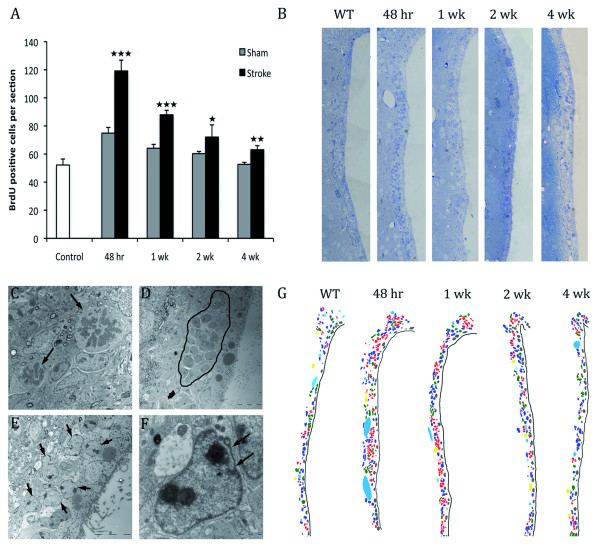
Figure 6.
SVZ activation after thrombotic stroke. A) SVZ quantification of BrdU+ cells at different time points (48hr, 1 wk, 2wk and 4wk). Cells were counted in the ipsilateral side of ischemic brains and in non-ischemic brains. Data are represented as the mean ± SD (n = 5)(Student's t test ***P < 0,0005; **P < 0,005 and *P < 0,05). B) SVZ semithin sections indicating activation of the proliferation. C-F) Transmission electron micrographs of common events in activation of proliferation. C shows two mitoses pointed by arrows. D shows a robust migrating chain encircled by a line. E shows an accumulation of augmented astrocytes, pointed by arrows. F highlights an invaginated astrocyte. G) Coloured reconstruction based on EM photomerged images showing the different cell types increase after stroke. Dark-blue: astrocytes, green: Type-C cells, red: neuroblasts, grey: ependymal cells, yellow: neurons, violet: microglia and blue: blood vessels. There is a remarkable activation 48hr after stroke with an increase in the number of type-B, type-C and type-A cells.

