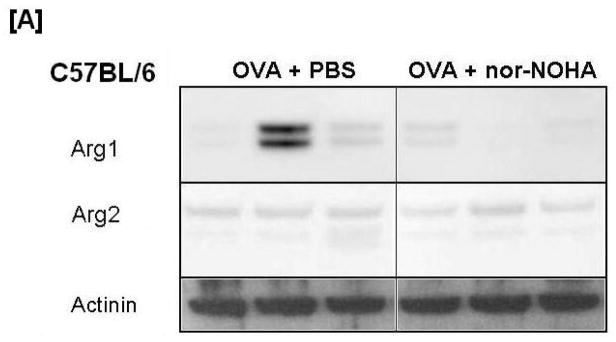
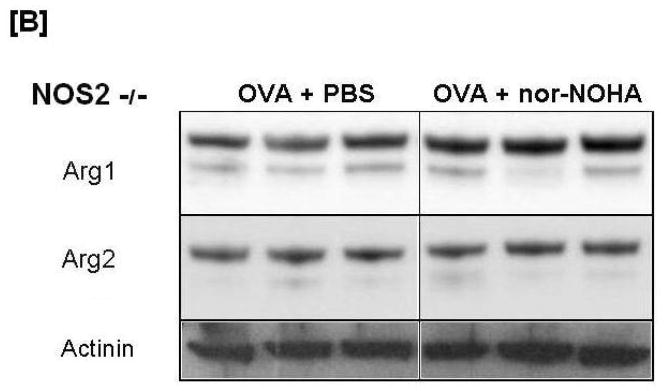
Figure 6.
Effect of arginase inhibition on Arginase1 [A] and Arginase2 [B] content in Western blot images from C57BL/6 and NOS2−/− mice. Representative images of each treatment group are displayed with actinin content displayed below as a loading control. Variability of Arginase1 protein content in the C57BL/6 OVA group was observed in all 8 animals examined. This variability was not observed in any other treatment group.


