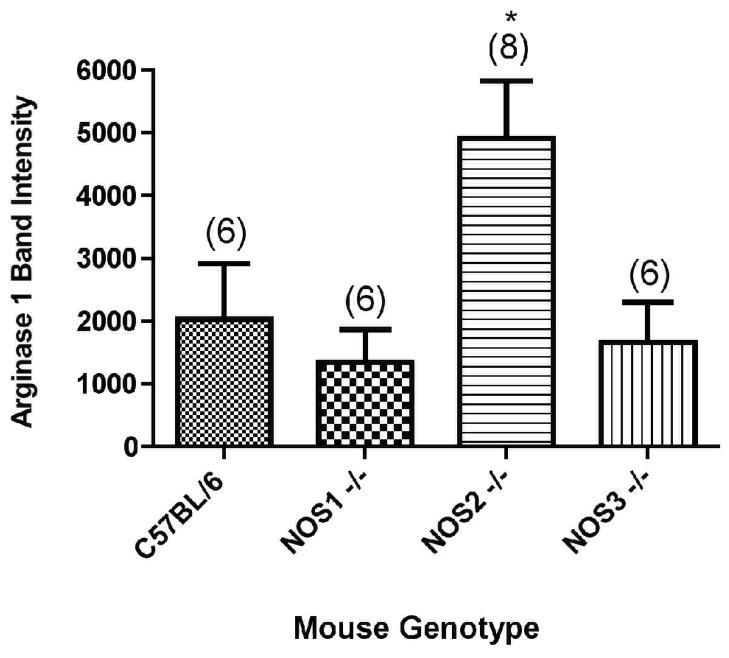
Figure 7.
Arginase1 expression levels in C57BL/6, NOS1−/−, NOS2−/−, and NOS3−/− mice exposed to OVA as quantified by Western blot analysis of isolated airways. N, the number of animals per group, is indicated in parentheses. *p<0.05 compared to the expression levels in the NOS1−/− and NOS3−/− strains.

