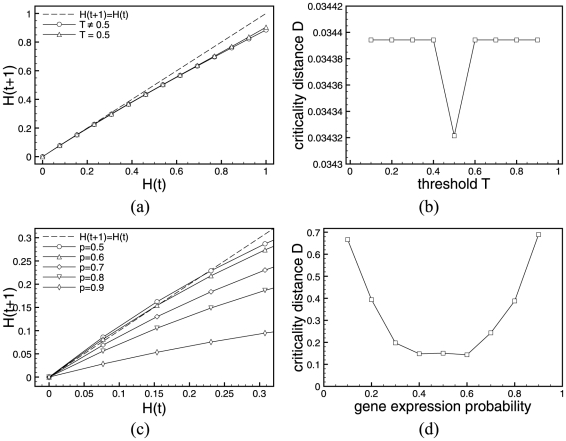
Figure 9. Critical threshold and gene expression probability.
Derrida plots (a)(c) and criticality distance vs. the threshold (b), respectively gene expression probability (d). The upper row (a)(b) shows the ABA system where the original rules have been replaced by ADA update function. In the lower row (c)(d), rules have been replaced by RUF and results are averaged over 100 random rules sets.

