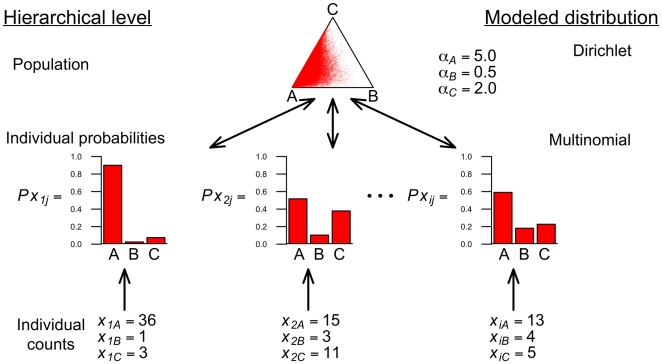
Figure 1. Schematic of hierarchical Bayesian model for count data.
Individual count data inform the parameters for each individual's multinomial parameters. The multinomial parameters for all individuals inform the population level preference modeled as a Dirichlet. This population-level preference is shown as a ternary diagram (a triangle plot). The population-level preference, in turn, informs the most likely individual multinomial parameters given the population preference. Thus, at each MCMC step information is passed from the individual preferences to the population preference, and vice versa. Note that the  's and
  are not fixed for the analysis. The role of the hyperpriors on w and q are not depicted in the figure.

