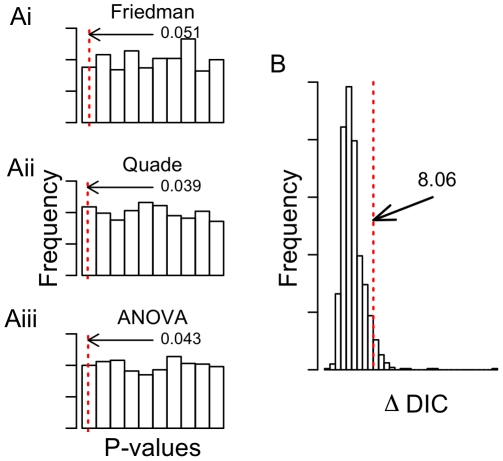
Figure 2. Simulations examining performance.
A) Performance of conventional methods for analyzing count/preference data. Red hatched line indicates the 0.05 quantile of p-values for 1000 data sets simulated under the null model of no preference. Numbers are the p-values of 0.05 quantile. Methods examined were the (i) Friedman test, (ii) the Quade test, and (iii) ANOVA on arcsin square root transformed proportions. B) Distribution of  DIC values for models with equal preference versus models with different preferences for each item. Red hatched line indicates the 0.95 quantile of
  DIC values.

