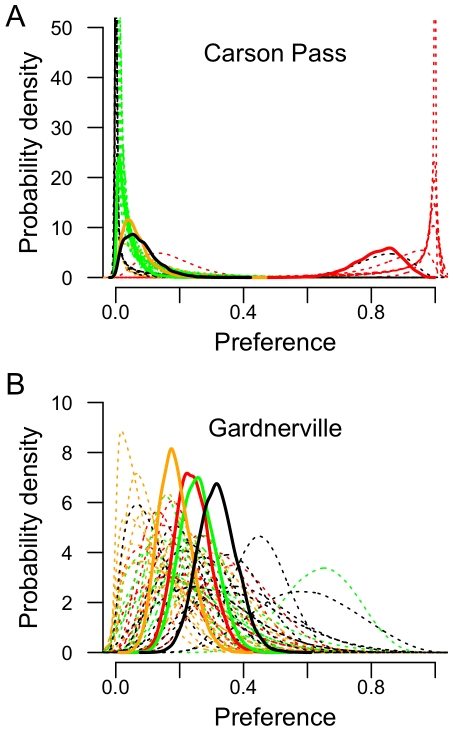
Figure 4. Population and individual preferences.
Population-level preferences (solid lines) and individual-level preferences (dotted lines) for each of the four host plants. Colors for each plant as in figure 3. Populations presented are A) Carson Pass and B) Gardnerville. Posterior densities estimated from 40000 MCMC steps following a burnin of 10000 generations.

