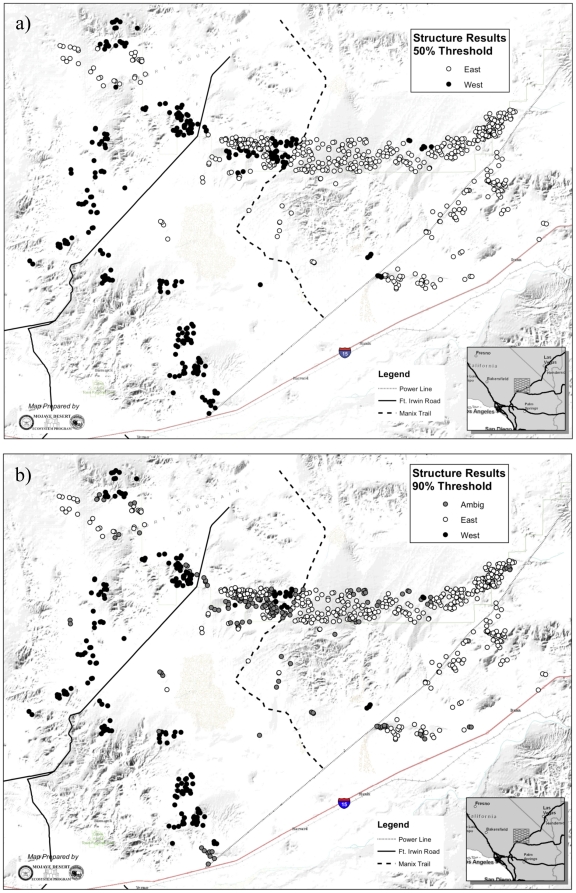
Figure 3. Results of STRUCTURE analysis, for a) 50% threshold and b) 90% threshold.
Black circles indicate individuals assigned with ≥50% (or ≥90%) probability of membership to the ‘West’ subpopulation, and white circles indicate individuals assigned with ≥50% (or ≥90%) probability of membership to the ‘East’ subpopulation.

