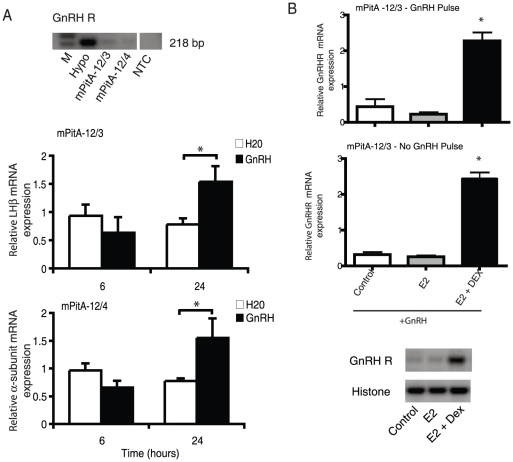
Figure 7. Characterization and functional analysis of gonadotrope cell lines.
(A) mPitA-12/3 or mPitA-12/4 cells were screened for the presence on GnRH receptor (GnRH R) mRNA by RT-PCR. Both lines were treated with GnRH (30 nM) for 6 and 24 h. LHβ and α-subunit mRNA expression were determined using real-time RT-PCR and levels were normalized to histone. (B) mPitA-12/3 cells were treated with GnRH (10 nM) over a four-day pulse paradigm (GnRH pulse) or with a single daily treatement (no GnRH pulse), in combination with 10 nM 17β-estradiol -/+ 20 nM dexamethasone. GnRH receptor mRNA expression was determined using semi-quantitative RT-PCR and levels were normalized to histone. A representative RT-PCR gel is shown. Data are expressed as mean ± SEM, n = 3-8 independent experiments. *p<0.05.

