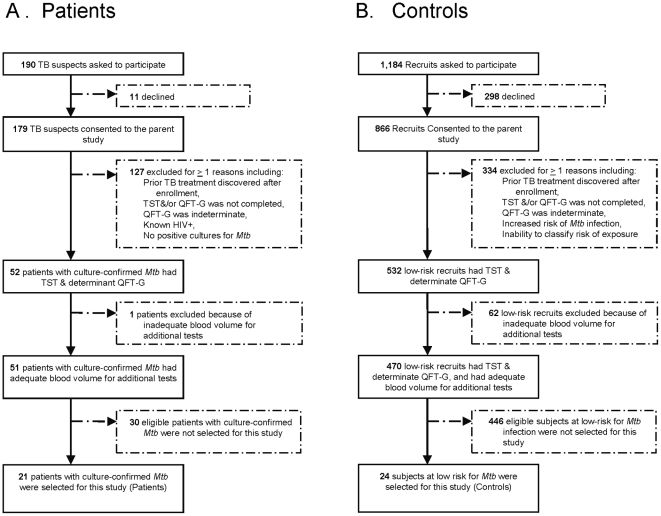
Figure 1. (A–B): Study participation diagram.
Panel A depicts selection of 21 patients with culture-confirmed tuberculosis (patients) from among 179 tuberculosis (TB) suspects enrolled in a previously described study [27]. Panel B depicts selection of 24 subjects at low risk for Mtb infection (controls) from among 866 Navy recruits enrolled in a previously described study [28]. No significant differences in characteristics of those selected or not selected were observed. Plasma samples from all 21 patients and 24 controls were assessed by the commercial ELISA, QuantiFERON-TB Gold test (QFT-G). Plasma samples from 6 patients and 10 controls were assessed by the in-house MMIA. Plasma samples from 6 patients and 7 controls were assessed by the microarray. Plasma samples from 12 patients and 12 control subjects were assessed by the commercial MMIA.

