Figure 2.
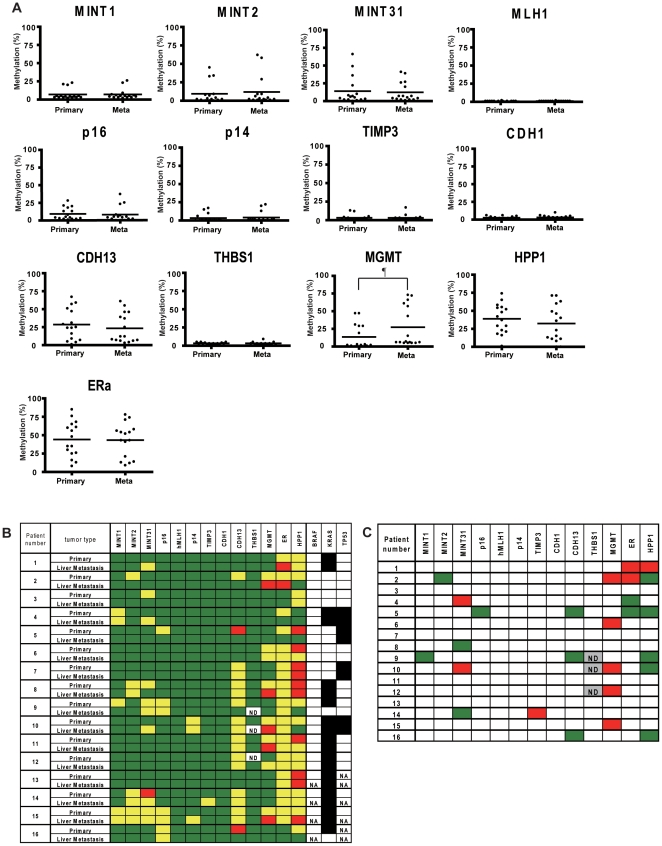
A) DNA methylation status of thirteen cancer-specific or age-related genes/CpG islands in 16 primary CRCs and matched liver metastasis. Each dot represents the methylation level of an individual sample. Horizontal lines represent mean methylation levels for each group. ¶, P = .013. Primary, primary CRCs; Mets, liver metastasis. B) DNA methylation and mutation status in 16 primary CRCs and paired liver metastases. Each column represents a separate gene locus indicated on top. Each row represents a primary or metastatic tumor. Average methylation density of less than 15% are shown in green, 15 to 50% in yellow and over 50% in red. Black square, presence of mutation; white square, absence of mutation; ND, not detected; NA, not applicable. C) Differences in methylation between primary CRCs and matched liver metastases. Red boxes denote an increase in methylation levels at metastatic tumors of more than two times higher when compared with primary tumors and the methylation level of at least one of the tumors is greater than 15%; green boxes show decrease of methylation levels at metastatic tumors of more than two times lower than primary tumors and the methylation level of at least one of the tumors is greater than 15%. White boxes are all others.

