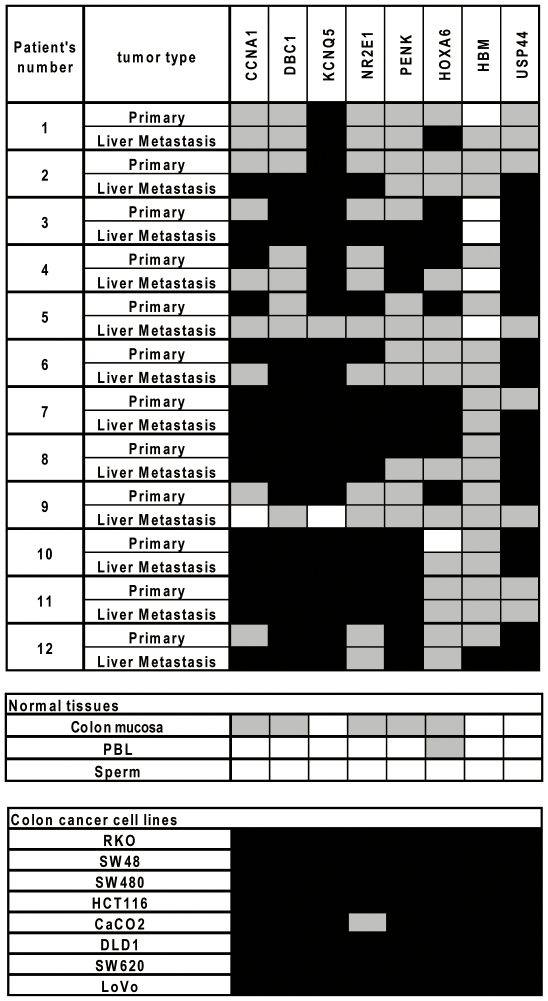
Figure 4. DNA methylation analysis for eight genes identified by MCAM in 12 paired primary CRCs and liver metastasis.
Each column represents a separate gene locus indicated on top. Each row represents a primary or metastatic tumor, normal tissue type or colon cancer cell. Average methylation densities of less than 15% are shown in white, 15 to 50% in gray and over 50% in black. PBL, peripheral blood.

